Lecture: sample size calculation
Identify all the factors that contribute to your sample size.
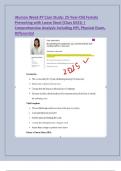
Variability
There are two types:
- Random effects (e.g. uncontrolled inter-individual differences)
o More difficult to control by the experimenter e.g. using an outbred strain
- Fixed effects (e.g. sex, strain, age, diet)
o E.g. can be included when using stratified design (randomized block
design) or accounted for via covariance analysis
o Under the control of the experimenter (can choose a certain strain, age,
environment etc.)
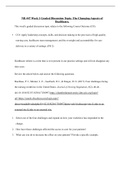
Variability has a major impact on statistical significance (we want to detect a signal
and the variability will contribute to the noise à signal to noise ratio).
Identification of important sources of variability: nested design.
Sample size
I. Factors affecting sample size
II. Power analysis
III. Resource equation
I. Factors affecting sample size
The following affect the sample size in your experiment:
- Objectives of the study
o Are there differences between the groups?
o How big are the differences between your groups (magnitude)?
- Type of data to be collected
o Categorical (e.g. alive/dead, male, female)
o Numerical (discrete (e.g. litter size) or continuous)
o Rank, percentage, …
§ Sample size: continuous numerical < categorical
- Uniformity of the experimental material
o The more uniform your animals are (all inbred/outbred animals), the
lower your variability
- Design of the experiment
o Will determine how easy or difficult your sample size calculation is going
to be
II. Power analysis
You use the power analysis when you have:
- A simple experiment (e.g. compare treated group with control group)
- Often experiments are repeated with slightly different ‘treatments’
o So you have an idea on the standard deviation (SD)
PAY ATTENTION: only when you cannot use the power equation/analysis, then you
will use the Resource equation (III). The resource equation is often easier but less
precise and also has many requisite (= demands = ‘eisen’) to be met in order to be valid.
Saif Haify Laboratory Animal Science – Summary 6-November-2015
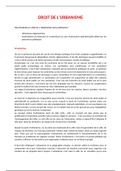
, The power analysis depends on the relationship between:
- Effect size of biological interest à difference you want to detect
o You need to dig up the literature
o When more than 1 dependent variable à choose the one that is of most
interest in the framework of your experiment
o E.g. what increase/decrease in body weight, in survivors
- Standard deviation à variability of your population
o From earlier reports, papers, researches done
o From a pilot study à if there is no SD known, then you can suggest to do a
pilot study
o Always conduct a ‘worst’ (least variability) and ‘best’ (highest variability)
case calculation
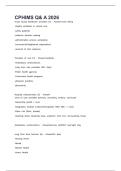
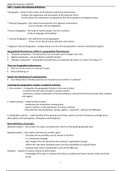
o You want to detect this curve, the difference between the two mean,
whether or not this difference is seen in another population. If you have a
big spread of data, it is more difficult to detect a difference and you need
more samples/animals
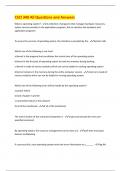
Delta = the difference between your two means that you should detect. The variability
between your control group and experimental (treatment) group are going to overlap
and is too big, which means you are going to need more animals included in order to get
a more accurate estimate.
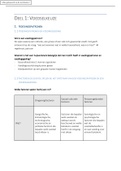
- Significance level à Significance level typically is 5%
o = the probability that the experiment will give a false positive result i.e.
that a ‘statistically significant’ effect is found when in fact it is entirely due
to the chance sampling error (type I error, falsely reject the H0)
o Commonly P = 0.05
o The significance level is inversely related to the chance of a false negative
result (= failing to detect a true biological effect, type II error)
- Desired power à how strong is your method; must be at least 80%
o = the probability of detecting the specified effect at the specified
significance level
o Usually set between 80 and 90%
o Conversely related (= ‘omgekeerd evenredig) to sample size à so if your
power increases, your sample size decreases!
Saif Haify Laboratory Animal Science – Summary 6-November-2015
Identify all the factors that contribute to your sample size.
Variability
There are two types:
- Random effects (e.g. uncontrolled inter-individual differences)
o More difficult to control by the experimenter e.g. using an outbred strain
- Fixed effects (e.g. sex, strain, age, diet)
o E.g. can be included when using stratified design (randomized block
design) or accounted for via covariance analysis
o Under the control of the experimenter (can choose a certain strain, age,
environment etc.)
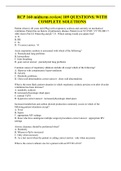
Variability has a major impact on statistical significance (we want to detect a signal
and the variability will contribute to the noise à signal to noise ratio).
Identification of important sources of variability: nested design.
Sample size
I. Factors affecting sample size
II. Power analysis
III. Resource equation
I. Factors affecting sample size
The following affect the sample size in your experiment:
- Objectives of the study
o Are there differences between the groups?
o How big are the differences between your groups (magnitude)?
- Type of data to be collected
o Categorical (e.g. alive/dead, male, female)
o Numerical (discrete (e.g. litter size) or continuous)
o Rank, percentage, …
§ Sample size: continuous numerical < categorical
- Uniformity of the experimental material
o The more uniform your animals are (all inbred/outbred animals), the
lower your variability
- Design of the experiment
o Will determine how easy or difficult your sample size calculation is going
to be
II. Power analysis
You use the power analysis when you have:
- A simple experiment (e.g. compare treated group with control group)
- Often experiments are repeated with slightly different ‘treatments’
o So you have an idea on the standard deviation (SD)
PAY ATTENTION: only when you cannot use the power equation/analysis, then you
will use the Resource equation (III). The resource equation is often easier but less
precise and also has many requisite (= demands = ‘eisen’) to be met in order to be valid.
Saif Haify Laboratory Animal Science – Summary 6-November-2015
, The power analysis depends on the relationship between:
- Effect size of biological interest à difference you want to detect
o You need to dig up the literature
o When more than 1 dependent variable à choose the one that is of most
interest in the framework of your experiment
o E.g. what increase/decrease in body weight, in survivors
- Standard deviation à variability of your population
o From earlier reports, papers, researches done
o From a pilot study à if there is no SD known, then you can suggest to do a
pilot study
o Always conduct a ‘worst’ (least variability) and ‘best’ (highest variability)
case calculation
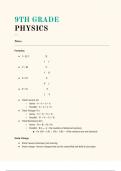
o You want to detect this curve, the difference between the two mean,
whether or not this difference is seen in another population. If you have a
big spread of data, it is more difficult to detect a difference and you need
more samples/animals
Delta = the difference between your two means that you should detect. The variability
between your control group and experimental (treatment) group are going to overlap
and is too big, which means you are going to need more animals included in order to get
a more accurate estimate.
- Significance level à Significance level typically is 5%
o = the probability that the experiment will give a false positive result i.e.
that a ‘statistically significant’ effect is found when in fact it is entirely due
to the chance sampling error (type I error, falsely reject the H0)
o Commonly P = 0.05
o The significance level is inversely related to the chance of a false negative
result (= failing to detect a true biological effect, type II error)
- Desired power à how strong is your method; must be at least 80%
o = the probability of detecting the specified effect at the specified
significance level
o Usually set between 80 and 90%
o Conversely related (= ‘omgekeerd evenredig) to sample size à so if your
power increases, your sample size decreases!
Saif Haify Laboratory Animal Science – Summary 6-November-2015