

MATH 302 QUIZ 5 – QUESTION AND ANSWERS SET 1
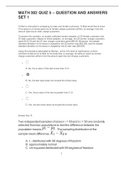
MATH 302 QUIZ 5 – QUESTION AND ANSWERS SET 1 Q-Mart is interested in comparing its male and female customers. Q-Mart would like to know if the amount of money spent by its female charge customers differs, on average, from the amount spent by its male charge customers. To answer this question, an analyst collected random samples of 25 female customers and 22 male customers. Based on these samples, on average, the 25 women charge customers spent $102.23 and the 22 men charge customers spent $86.46. Moreover, the sample standard deviation of the amount charged by the 25 women was $93.393, and the sample standard deviation of the amount charged by the 22 men was $59.695. Using the procedure advocated by Bluman, at the 10% level of significance, is there sufficient evidence for Q-Mart to conclude that, on average, the amount spent by women charge customers differs from the amount spent by men charge customers. • A. No, the p-value of this test is less than 0.10. • B. No, the test value does not exceed the critical value. • C. Yes, the p-value of this test is greater than 0.10 • D. Yes, the test value does not exceed the critical value Answer Key: B Two independent samples of sizes n1 = 50 and n2 = 50 are randomly selected from two populations to test the difference between the population means, . The sampling distribution of the sample mean difference, is: A. t distributed with 98 degrees of freedom B. approximately normal C. chisquared distributed with 99 degrees of freedom D. normally distributed Answer Key: B A researcher hypothesizes that the variation in the amount of money spent on business dinners is greater than the variation of the amount of money spent on lunches. The variance of nine business dinners was $6.12 and the variance of 12 business lunches was $0.87. What is the test value? • A. 7.03 • B. 9.61 • C. 49.50 • D. 3.10 Answer Key: A In regression analysis, the variable we are trying to explain or predict is called the • A. independent variable • B. residual variable • C. regression variable • D. dependent variable Answer Key: D In a simple linear regression analysis, the following sum of squares are produced: = 400 = 80 = 320 The proportion of the variation in Y that is explained by the variation in X is: A. 25% B. 50% C. 20% D. 80% Answer Key: D Correlation is a summary measure that indicates: • A. the strength of the linear relationship between pairs of variables • B. a curved relationship among the variables • C. the rate of change in Y for a one unit change in X • D. the magnitude of difference between two variables Answer Key: A The regression line y' = -3 + 2.5 X has been fitted to the data points (28, 60), (20, 50), (10, 18), and (25, 55). The sum of the squared residuals will be: • A. 16.00 • B. 20.25 • C. 49.00 • D. 94.25 Answer Key: D The marketing manager of a large supermarket chain would like to use shelf space to predict the sales of pet food. For a random sample of 12 similar stores, she gathered the following information regarding the shelf space, in feet, devoted to pet food and the weekly sales in hundreds of dollars. . Store 1 2 3 4 5 6 Shelf Space 5 5 5 10 10 10 Weekly Sales 1.6 2.2 1.4 1.9 2.4 2.6 Store 7 8 9 10 11 12 Shelf Space 15 15 15 20 20 20 Weekly Sales 2.3 2.7 2.8 2.6 2.9 3.1 Compute the value of the sample correlation coefficient between weekly sales and shelf space. • A. 0.652 • B. 0.308 • C. 0.827 • D. 0.684 Answer Key: C A field researcher is gathering data on the trunk diameters of mature pine and spruce trees in a certain area. The following are the results of his random sampling. Can he conclude, at the 0.10 level of significance, that the average trunk diameter of a pine tree is greater than the average diameter of a spruce tree? Pine trees Spruce trees Sample size 30 35 Mean trunk diameter (cm) 45 39 Sample variance 120 140 What is the test value for this hypothesis test? Test value: 2.474 Round your answer to three decimal places. What is the critical value? Critical value: 1.296 Round your answer to three decimal places. Answer Key: 2.121, 1.311 The marketing manager of a large supermarket chain would like to determine the effect of shelf space (in feet) on the weekly sales of international food (in hundreds of dollars). A random sample of 12 equal –sized stores is selected, with the following results: Store Shelf Space(X) Weekly Sales(Y) 1 10 2.0 2 10 2.6 3 10 1.8 4 15 2.3 5 15 2.8 6 15 3.0 7 20 2.7 8 20 3.1 9 20 3.2 10 25 3.0 11 25 3.3 12 25 3.5 Based on these data, what are the least squares regression coefficients of the Yintercept (a) and slope (b)? Place your answers, rounded to 3 decimal places , in the blanks provided. a = 1.48 b = 0.074 Answer Key: 1.480, 0.074
Document information
- Uploaded on
- June 22, 2022
- Number of pages
- 7
- Written in
- 2021/2022
- Type
- Exam (elaborations)
- Contains
- Questions & answers


