MULTIVARIATE ANALYSE
Lecture notes
To construct a scale:
- Select the indication of the concept – ‘statistics anxiety’
- Study the frequency of each indicator
o Missing values – different scales – direction (positive/negative)
o Recode, standardize
- Determine the dimensionality using factor analysis
- Perform reliability analysis
- Construct the scale
o Via ‘compute’ in SPSS
Factor analysis: examining dimensionality
- About the dimensionality the following questions can be asked:
o Are there dimensions (factors), subgroups of related variables, in the set of
indicators? How many?
o How can the different dimensions (factors) be interpreted?
o Are the dimensions correlated?
There could be two directions (statistics/friends)
- In the output of SPSS you will find information on:
o The number of dimensions (= factors)
o The interpretation of the dimensions (= factors)
o The correlation between them
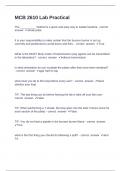
Kaiser’s criterium eigen value > 1.
- Criterion 2: point of inflexion minus 1.
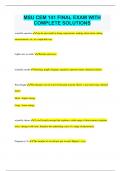
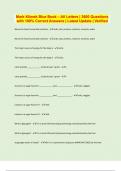
,How to interpret the dimensions (=factors)?
- By the factorloadings in the pattern matrix: stronger loadings indicate a strong
relation with the underlying concept.
o Factor 1 = fear of statistics
o Factor 2 = friends are load highly.
- Two dimensions fear of statistics and friends
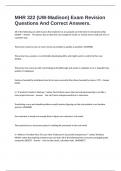
o Are there a correlation?
Negative correlation: the higher the fear of statistics, lower the
friends.
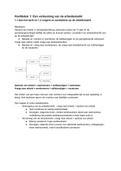
,Hoorcollege 1: Factoranalyse
Schaalconstructie: wanneer gebruiken we factoranalyse?
De voorbeelden betreffen allemaal concepten die niet direct met een enkele vraag in
een vragenlijst te meten zijn
Elk concept is geoprationaliseerd, vertaald in concrete items, of indicatoren. Niet
direct observeerbaar.
Een (achterliggend) concept is niet direct observeerbaar, en wordt daarom ook wel
een latente variabele genoemd.
De vraag is echter: weerspiegelen deze afzonderlijke variabelen echt één en
hetzelfde achterliggende concept?
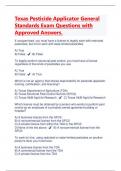
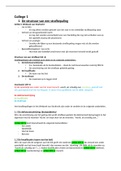
, Na factoranalyse:
Lecture notes
To construct a scale:
- Select the indication of the concept – ‘statistics anxiety’
- Study the frequency of each indicator
o Missing values – different scales – direction (positive/negative)
o Recode, standardize
- Determine the dimensionality using factor analysis
- Perform reliability analysis
- Construct the scale
o Via ‘compute’ in SPSS
Factor analysis: examining dimensionality
- About the dimensionality the following questions can be asked:
o Are there dimensions (factors), subgroups of related variables, in the set of
indicators? How many?
o How can the different dimensions (factors) be interpreted?
o Are the dimensions correlated?
There could be two directions (statistics/friends)
- In the output of SPSS you will find information on:
o The number of dimensions (= factors)
o The interpretation of the dimensions (= factors)
o The correlation between them
Kaiser’s criterium eigen value > 1.
- Criterion 2: point of inflexion minus 1.
,How to interpret the dimensions (=factors)?
- By the factorloadings in the pattern matrix: stronger loadings indicate a strong
relation with the underlying concept.
o Factor 1 = fear of statistics
o Factor 2 = friends are load highly.
- Two dimensions fear of statistics and friends
o Are there a correlation?
Negative correlation: the higher the fear of statistics, lower the
friends.
,Hoorcollege 1: Factoranalyse
Schaalconstructie: wanneer gebruiken we factoranalyse?
De voorbeelden betreffen allemaal concepten die niet direct met een enkele vraag in
een vragenlijst te meten zijn
Elk concept is geoprationaliseerd, vertaald in concrete items, of indicatoren. Niet
direct observeerbaar.
Een (achterliggend) concept is niet direct observeerbaar, en wordt daarom ook wel
een latente variabele genoemd.
De vraag is echter: weerspiegelen deze afzonderlijke variabelen echt één en
hetzelfde achterliggende concept?
, Na factoranalyse: