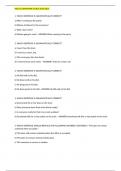
Party No. MPs % vote % seats % vote – % seats Seats/million votes
Conservatives 365 43.6 56.2 -12.6 26.1
Labour 203 32.2 31.2 +1 19.7
SNP 48 3.9 7.4 -3.5 38.6
Lib Dems 11 11.5 1.7 +9.8 3.0
DUP 8 0.8 1.2 -0.4 32.8
Sinn Fein 7 0.6 1.1 -0.5 38.5
Plaid Cymru 4 0.5 0.6 -0.1 26.1
SDLP 2 0.4 0.3 +1 16.8
Green 1 2.7 0.2 +2.5 1.2
Alliance 1 0.4 0.2 +0.2 7.5
Negative = Total seats/total votes
overrepresented, x 1 million = 13.7
positive =
underrepresented