Ecology
Habitat - a place where an organism lives.
Population - all the organisms of one species in a habitat.
Community - all the different species in a habitat.
Ecosystem - all the organisms living in an are and the non living factors.
Biodiversity is the variety of different species within an ecosystem (or on earth). High biodiversity = more stable
ecosystems. It reduces the dependence between different species. Factors which reduce biodiversity -
deforestation, global warming, pollution.
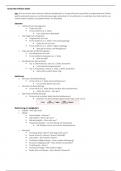
Factors which affect
ecosystems may be
biotic (living factors)
or abiotic (non living
factors)
Food availability - in areas with lots of food, there is likely to be more organisms, and less competition.Organisms may
only eat certain foods, so may only be found in ecosystems where it is available. If more food becomes available, the
population would increase.
Disease - could affect one species, resulting in a decline in that species numbers.
Competition - An increase in competition may result in decline of a specie, those better adapted survive and
reproduce.
- Animals compete for food, mates, shelter and water.
- Plants compete for light, space, water and minerals.
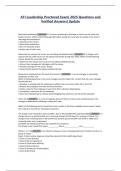
Increase in predators: An increase in a predator will cause the number of prey to decrease. Over time, due to
lack of food, the number of predators decreases, so prey starts to increase again in a cycle.
Temperature affects animals and plants - certain organisms are adapted to be in specific climates.
Light affects plants - more light (and water and mineral ions) can result in an abundance of plants
Changes to soil pH can reduce the mineral ion availability and uptake of mineral ions by root hair cells.
Toxic chemicals:
- Pesticides - chemicals which kill pests - can enter and build up in an an organism
(bioaccumulation) or be passed along a food chain (biomagnification) and can disrupt food
chains.
- Fertilisers, such as nitrates, can dissolve in water and leach into lakes, known as eutrophication,
causing death of organisms there.
, Sampling:
Sampling is a way of estimating the population size of a species in a given area.
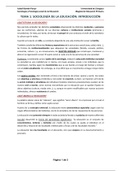
Method:
1. Place 2 tape measures at right angles
2. Use a random number generator from the internet to generate
random coordinates - this is where you place the quadrat
3. Count the number of that species in the quadrat (small animal /
plant)
4. Repeat, at least ten times (for reliability)
5. Calculate the mean number of organisms per quadrat, then multiply by the area of the habitat
(providing your quadrat is 1m2)
If your quadrat is not 1m2, first divide the mean by the area of quadrat - eg, quadrat is 0.5m2, mean of
12 daisies per quadrat, field is 25 m2:
.5 = 24 daisies per m2, x 25 = 600 daisies
- Sometimes it may ask you to measure biomass within an area, all of the steps are the same, but
instead of counting, you measure the mass using a balance.
- You can also use them to compare the number of species in two fields, where an abiotic factor
differs, such as light intensity.
Random sampling TS only:
- Instead of counting just one species, it may ask you to compare biodiversity in two areas.
- The method is the same (still random), but you just count and compare all the different species.
- The area with the most even distribution of different species is more biodiverse.
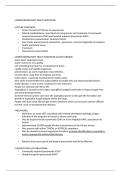
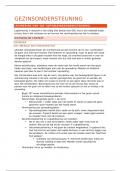
Systematic sampling:
You can also use a belt transect to study distribution across a
habitat. (It is not random)
You will usually use belt transects to show how a changing
abiotic factor affects growth
- Under the tree less light
- Less photosynthesis
- Less glucose produced
- Less energy for growth
Method:
1. Place a tape measure in the area you want to
investigate.
2. Place quadrat at start and count number of species
3. Repeat, but at regular intervals - such as every 2m.
To improve reliability, repeat using at least 2 more transects
Food Chains / Webs:
Food chains show what’s eaten by what. Arrows show the flow of energy through a food chain (all
energy originates from the sun)Each stage in the food chain is called a trophic level.
Habitat - a place where an organism lives.
Population - all the organisms of one species in a habitat.
Community - all the different species in a habitat.
Ecosystem - all the organisms living in an are and the non living factors.
Biodiversity is the variety of different species within an ecosystem (or on earth). High biodiversity = more stable
ecosystems. It reduces the dependence between different species. Factors which reduce biodiversity -
deforestation, global warming, pollution.
Factors which affect
ecosystems may be
biotic (living factors)
or abiotic (non living
factors)
Food availability - in areas with lots of food, there is likely to be more organisms, and less competition.Organisms may
only eat certain foods, so may only be found in ecosystems where it is available. If more food becomes available, the
population would increase.
Disease - could affect one species, resulting in a decline in that species numbers.
Competition - An increase in competition may result in decline of a specie, those better adapted survive and
reproduce.
- Animals compete for food, mates, shelter and water.
- Plants compete for light, space, water and minerals.
Increase in predators: An increase in a predator will cause the number of prey to decrease. Over time, due to
lack of food, the number of predators decreases, so prey starts to increase again in a cycle.
Temperature affects animals and plants - certain organisms are adapted to be in specific climates.
Light affects plants - more light (and water and mineral ions) can result in an abundance of plants
Changes to soil pH can reduce the mineral ion availability and uptake of mineral ions by root hair cells.
Toxic chemicals:
- Pesticides - chemicals which kill pests - can enter and build up in an an organism
(bioaccumulation) or be passed along a food chain (biomagnification) and can disrupt food
chains.
- Fertilisers, such as nitrates, can dissolve in water and leach into lakes, known as eutrophication,
causing death of organisms there.
, Sampling:
Sampling is a way of estimating the population size of a species in a given area.
Method:
1. Place 2 tape measures at right angles
2. Use a random number generator from the internet to generate
random coordinates - this is where you place the quadrat
3. Count the number of that species in the quadrat (small animal /
plant)
4. Repeat, at least ten times (for reliability)
5. Calculate the mean number of organisms per quadrat, then multiply by the area of the habitat
(providing your quadrat is 1m2)
If your quadrat is not 1m2, first divide the mean by the area of quadrat - eg, quadrat is 0.5m2, mean of
12 daisies per quadrat, field is 25 m2:
.5 = 24 daisies per m2, x 25 = 600 daisies
- Sometimes it may ask you to measure biomass within an area, all of the steps are the same, but
instead of counting, you measure the mass using a balance.
- You can also use them to compare the number of species in two fields, where an abiotic factor
differs, such as light intensity.
Random sampling TS only:
- Instead of counting just one species, it may ask you to compare biodiversity in two areas.
- The method is the same (still random), but you just count and compare all the different species.
- The area with the most even distribution of different species is more biodiverse.
Systematic sampling:
You can also use a belt transect to study distribution across a
habitat. (It is not random)
You will usually use belt transects to show how a changing
abiotic factor affects growth
- Under the tree less light
- Less photosynthesis
- Less glucose produced
- Less energy for growth
Method:
1. Place a tape measure in the area you want to
investigate.
2. Place quadrat at start and count number of species
3. Repeat, but at regular intervals - such as every 2m.
To improve reliability, repeat using at least 2 more transects
Food Chains / Webs:
Food chains show what’s eaten by what. Arrows show the flow of energy through a food chain (all
energy originates from the sun)Each stage in the food chain is called a trophic level.