MATH 225N Week 2 Assignment; Line and Bar Graphs
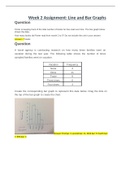
1. Question: A travel agency is conducting research on how many times families went on vacation during the last year. The following table shows the number of times sampled families went on vacation. Create the corresponding bar graph to represent this data below. Drag the dots on the top of the bar graph to create the chart. 2. Question: According to the given data, what can the travel agency conclude about the sampled families? 3. Question: Josslyn is a car salesperson who keeps track of her sales over time. The line graph below shows how many cars she sells per week. What was the change in cars sold from week 2 to 6? Do not include the unit in your 4. Question: Marc is keeping track of the total number of movies he has watched over time. The line graph below shows the data where the number of movies corresponds to the number of movies that had been watched at the beginning of the week shown on the horizontal axis. How many movies did Marc watch between the beginning of week 1 and the beginning of week 5? Do not include the unit in your answer. 5. Question: The data listed below represents the distance from a city taxi depot (to the nearest mile) by the number of hours since a taxi left the depot to pick up passengers. Create the corresponding line graph to represent this data below. 6. Question: According to the information above, which of the following is an appropriate analysis of the taxi's distance? 7. Question: The bar graph below shows the number of men and women in different clubs. What is the total number of women across all the clubs shown? Do not include the units in your answer. 8. Question: The bar graph below shows the number of men and women in different classes. How many total students are in the Chemistry class? Do not include the units in your answer. 9. Question: The data listed below represents the number of vacation days taken in the span of one year by the number of employees. Create the corresponding line graph to represent this data below. 10. Question: According to the information above, which of the following is an appropriate analysis of the vacation takes taken by employees? 11. Question: Horace is trying to improve at golf. So, he keeps track of the number of the total rounds he has played over time. The line graph below shows the data. 12. Question: Alice is keeping track of the total number of books she has read over time. The line graph below shows the data. How many books did Alice read from month 2 to 3? Do not include the unit in your 13. Question: The data listed below represents the number of TVs in a house by family size. Create the corresponding line graph to represent this data below. 14. Question: According to the information above, what family sizes have 6 TVs in their household? 15. Question: The data listed below represents the number of minutes spent texting on a Friday night by age (in years). Create the corresponding line graph to represent this data below. 16. Question: According to the information above, which of the following is an appropriate analysis of texting? 17. Question: The data listed below represents the number of trees planted by the number of benches in a park. Create the corresponding line graph to represent this data below. 18. Question: According to the information above, which of the following is an appropriate analysis of the trees planted?
Document information
- Uploaded on
- October 15, 2021
- Number of pages
- 14
- Written in
- 2021/2022
- Type
- Other
- Person
- Unknown