

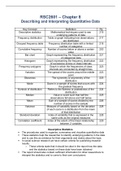
RSC2601 – Chapter 8
Describing and Interpreting Quantitative Data
Key Concept Definition Pg.
Descriptive statistics Mathematical techniques used to see 215
underlying patterns of data
Frequency distribution Table or graph indicating how observations 217
are distributed
Grouped frequency table Frequency distribution table with a limited 218
number of categories
Cumulative frequency Number of scores below or above a certain 220
value
Bar chart Graph representing the frequency distribution 221
of categorical data
Histogram Graph representing the frequency distribution 222
of successive scores or class intervals
Frequency polygons Graph in which the frequencies of class 223
intervals are connected by straight lines
Variation The spread of the scores around the middle 223
point
Skewness The symmetry or asymmetry of the 223
distribution
Mode Score in a sample of scores that occurs with 224
the greatest frequency
Kurtosis of distribution Refers to the flatness or peakedness of the 224
distribution
Median Value or score such that half the 225
observations fall above and half below
Mean Sum of a sample of scores divided by the 226
number of scores in the sample
Variance Measure of variability based on the deviation 228
of each score in a distribution from the mean
of that distribution
Standard deviation Index of variability that is expressed in the 228
same units as the original measures
Correlation coefficient Index of the extent of the linear relationship 229
between 2 variables
Descriptive Statistics
The procedures used to organise, summarise and visualise quantitative data
These statistics help the researcher to identify underlying patterns in the data
and to use this as evidence for their arguments and claims about the topic
In social science research we have certain criteria for publishing research
results
o These criteria state that it should be clear in the report how the data
and the statistics based on these data have been obtained
The report should also contain sufficient information for other researchers to
interpret the statistics and to come to their own conclusions
, Tables and Graphs
Being able to interpret descriptive statistics helps to evaluate claims more
carefully rather than blindly accepting statistical data
Frequency distribution tables:
Definition in table
Indicates the number of cases in a data set that obtained a particular score or
fall in a particular category of a variable
Grouping of raw data
The number of cases is called the frequency of that score or category
The symbol ƒ is used to refer to frequency
First column – ordered list of all the possible scores or a list of the categories
Then count the number of times each score or category occurs
To help us count, we use the second column of the table and make a tally
mark every time a score or category is observed
o Every 5th mark a line is drawn through
o Usually don’t include this column in the final presentation
The total frequency is written in the 3rd column and the sum of these
frequencies should be the same as. The number of cases in the sample
Categories should be mutually exclusive (a case cannot be classified in more
than 1 category)
Grouped frequency table – definition in table
o Scores are grouped into so-called class intervals that each include a
series of scores
o Intervals should suit the data and there should be enough intervals to
include all the data
o Usually choose intervals of equal size
o Some information is lose in grouped frequency distribution
o Class intervals – the midpoint of the interval can be used to represent
all the values in a particular interval
Sometimes we are concerned with the number of scores (frequencies) greater
than or less than a specified value
o The cumulative frequency (cƒ) of a class interval is the number of
cases in the specified interval plus all the cases in the previous
intervals
o Definition in table – cumulative frequency
Percentages:
Percentage is determined by dividing the frequency by the total number of
cases (n) and then multiplying it by 100
% = ƒ/n x 100
Useful – not only is the number of persons in a specific category or class
interval taken into account, but also the total number of persons in the sample
Graphic representation of frequency distributions:
Advantage -make it easier to obtain an overall impression of the data
Describing and Interpreting Quantitative Data
Key Concept Definition Pg.
Descriptive statistics Mathematical techniques used to see 215
underlying patterns of data
Frequency distribution Table or graph indicating how observations 217
are distributed
Grouped frequency table Frequency distribution table with a limited 218
number of categories
Cumulative frequency Number of scores below or above a certain 220
value
Bar chart Graph representing the frequency distribution 221
of categorical data
Histogram Graph representing the frequency distribution 222
of successive scores or class intervals
Frequency polygons Graph in which the frequencies of class 223
intervals are connected by straight lines
Variation The spread of the scores around the middle 223
point
Skewness The symmetry or asymmetry of the 223
distribution
Mode Score in a sample of scores that occurs with 224
the greatest frequency
Kurtosis of distribution Refers to the flatness or peakedness of the 224
distribution
Median Value or score such that half the 225
observations fall above and half below
Mean Sum of a sample of scores divided by the 226
number of scores in the sample
Variance Measure of variability based on the deviation 228
of each score in a distribution from the mean
of that distribution
Standard deviation Index of variability that is expressed in the 228
same units as the original measures
Correlation coefficient Index of the extent of the linear relationship 229
between 2 variables
Descriptive Statistics
The procedures used to organise, summarise and visualise quantitative data
These statistics help the researcher to identify underlying patterns in the data
and to use this as evidence for their arguments and claims about the topic
In social science research we have certain criteria for publishing research
results
o These criteria state that it should be clear in the report how the data
and the statistics based on these data have been obtained
The report should also contain sufficient information for other researchers to
interpret the statistics and to come to their own conclusions
, Tables and Graphs
Being able to interpret descriptive statistics helps to evaluate claims more
carefully rather than blindly accepting statistical data
Frequency distribution tables:
Definition in table
Indicates the number of cases in a data set that obtained a particular score or
fall in a particular category of a variable
Grouping of raw data
The number of cases is called the frequency of that score or category
The symbol ƒ is used to refer to frequency
First column – ordered list of all the possible scores or a list of the categories
Then count the number of times each score or category occurs
To help us count, we use the second column of the table and make a tally
mark every time a score or category is observed
o Every 5th mark a line is drawn through
o Usually don’t include this column in the final presentation
The total frequency is written in the 3rd column and the sum of these
frequencies should be the same as. The number of cases in the sample
Categories should be mutually exclusive (a case cannot be classified in more
than 1 category)
Grouped frequency table – definition in table
o Scores are grouped into so-called class intervals that each include a
series of scores
o Intervals should suit the data and there should be enough intervals to
include all the data
o Usually choose intervals of equal size
o Some information is lose in grouped frequency distribution
o Class intervals – the midpoint of the interval can be used to represent
all the values in a particular interval
Sometimes we are concerned with the number of scores (frequencies) greater
than or less than a specified value
o The cumulative frequency (cƒ) of a class interval is the number of
cases in the specified interval plus all the cases in the previous
intervals
o Definition in table – cumulative frequency
Percentages:
Percentage is determined by dividing the frequency by the total number of
cases (n) and then multiplying it by 100
% = ƒ/n x 100
Useful – not only is the number of persons in a specific category or class
interval taken into account, but also the total number of persons in the sample
Graphic representation of frequency distributions:
Advantage -make it easier to obtain an overall impression of the data


