Exam |Elaborated| MATH-225: Statistical Reasoning for the Health Sciences Final Exam
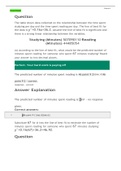
Exam |Elaborated| MATH-225: Statistical Reasoning for the Health Sciences Final Exam MATH 225-WK Final Exam-2021Exam |Elaborated| MATH-225: Statistical Reasoning for the Health Sciences Final ExamExam |Elaborated| MATH-225: Statistical Reasoning for the Health Sciences Final ExamThe table shows data collected on the relationship between the time spent studying per day and the time spent reading per day. The line of best fit for the data is yˆ=0.16x+36.2. Assume the line of best fit is significant and there is a strong linear relationship between the variables.The table shows data collected on the relationship between the time spent studying per day and the time spent reading per day. The line of best fit for the data is yˆ=0.16x+36.2. Studying (Minutes) Reading (Minutes) (a) According to the line of best fit, the predicted number of minutes spent reading for someone who spent 67 minutes studying is 46.92.Michelle is studying the relationship between the hours worked (per week) and time spent reading (per day) and has collected the data shown in the table. The line of best fit for the data is yˆ=−0.79x+98.8. Assume the line of best fit is significant and there is a strong linear relationship between the variablesMichelle is studying the relationship between the hours worked (per week) and time spent reading (per day) and has collected the data shown in the table. The line of best fit for the data is yˆ=−0.79x+98.8.MATH 225-WK Final Exam-2021
Document information
- Uploaded on
- September 8, 2021
- Number of pages
- 25
- Written in
- 2021/2022
- Type
- Exam (elaborations)
- Contains
- Questions & answers