
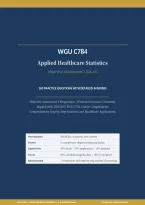
WGU C784
Applied Healthcare Statistics
Objective Assessment 1 (OA #1)
100 PRACTICE QUESTIONS WITH DETAILED ANSWERS
Objective Assessment 1 Preparation - Western Governors University
Aligned with 2026-2027 WGU C784 Course Competencies
Comprehensive Step-by-Step Solutions and Healthcare Applications
Total Questions 100 MCQs (4 options, one correct)
Sections 11 competency-aligned content domains
Cognitive Mix 30% recall / 50% application / 20% analysis
Format 60% calculation/application / 40% conceptual
Rationale Depth 2-4 sentences with step-by-step statistical reasoning
WGU C784 | Applied Healthcare Statistics | Z.ai Academic Series Confidential - Educational Use
,WGU C784 - Applied Healthcare Statistics OA #1 - 100 Practice Questions Latest 2026/2027 (Answered)
Examination Overview
Purpose: This 100-question practice examination is designed to prepare students for the WGU
C784 Applied Healthcare Statistics Objective Assessment 1 (OA #1). The questions cover all 11
course competency areas: foundations of statistics and data types; data collection and study
design; descriptive statistics; data visualization; probability fundamentals; Bayes' theorem and
medical test interpretation; probability distributions; sampling distributions and the Central
Limit Theorem; confidence intervals; hypothesis testing; and statistical tests (t-tests, ANOVA,
chi-square, correlation, regression). Each question includes a detailed rationale with
step-by-step statistical reasoning, healthcare application, and OA #1 preparation coaching.
How to use this document: Attempt all 100 questions across the 11 sections. Verify each
answer against the rationale and rework any missed questions. Pay special attention to
calculation-based items (sample variance, z-scores, confidence intervals, Bayes'/PPV/NPV, and
probability rules) and to conceptual distinctions (correlation vs. causation, statistical vs.
clinical significance, sensitivity vs. PPV, Type I vs. Type II errors) — these are highest-yield on
the OA #1.
Section Title Q Range # Qs
Section 1 Introduction to Statistics, Data Types, and Levels of MeasurementQ1-Q11 11
Section 2 Data Collection, Sampling Methods, Bias, and Study Design Q12-Q22 11
Section 3 Descriptive Statistics Q23-Q36 14
Section 4 Data Visualization and Graphical Interpretation Q37-Q44 8
Section 5 Probability Fundamentals Q45-Q54 10
Section 6 Bayes' Theorem and Medical Test Interpretation Q55-Q62 8
Section 7 Probability Distributions Q63-Q72 10
Section 8 Sampling Distributions and the Central Limit Theorem Q73-Q79 7
Section 9 Confidence Intervals for Means and Proportions Q80-Q86 7
Section 10 Hypothesis Testing Q87-Q94 8
Section 11 Statistical Tests Q95-Q100 6
TOTAL 100
WGU C784 OA #1 Page 2 100 Questions
, Section 1: Introduction to Statistics, Data Types, and Levels of Measurement
Descriptive vs. Inferential Statistics, Variable Types, & Levels of Measurement
Q1. A nurse researcher reports the average length of stay (LOS) for 350 patients
discharged from a hospital's cardiac unit last month was 4.7 days, and uses this to
estimate the average LOS for all cardiac patients in the hospital system over the past
year. The first statement (average = 4.7 days) is an example of which type of statistics,
and the second statement (estimating the broader population) is which type?
A. Both are descriptive statistics because both describe data.
B. The average of 4.7 days is descriptive statistics; using it to generalize beyond the
sample to a larger population is inferential statistics. [CORRECT]
C. The average of 4.7 days is inferential statistics; generalizing to the population is
descriptive statistics.
D. Both are inferential statistics because research is being conducted.
Correct Answer: B
Rationale: Descriptive statistics summarize and organize the characteristics of a sample (e.g.,
mean, standard deviation, frequencies). Inferential statistics use sample data to draw
conclusions or make predictions about a larger population (e.g., estimation, hypothesis
testing). The mean LOS of 4.7 days for the 350 patients describes the sample — descriptive.
Using that sample mean to estimate the average LOS for the broader population of cardiac
patients over the past year is inferential. OA #1 frequently tests this distinction by asking
students to classify a given statement.
Q2. A researcher collects data on patient blood types (A, B, AB, O) and Rh status
(positive, negative). Which level of measurement applies to blood type?
A. Ordinal — categories with a meaningful rank order
B. Nominal — categories with no inherent order [CORRECT]
C. Interval — ordered categories with equal spacing and no true zero
D. Ratio — ordered with equal spacing and a true zero
Correct Answer: B
Rationale: Blood type is a nominal variable: categories (A, B, AB, O) are mutually exclusive
labels with no inherent ranking or numeric meaning. Nominal data allow counts and modes
but not means or medians. Ordinal data (e.g., cancer Stage I-IV) have ordered categories
without equal spacing. Interval (e.g., Celsius temperature) has equal spacing but no true zero.
Ratio (e.g., weight, height, LOS) has equal spacing and a true zero — supporting all arithmetic
operations.
, Q3. A clinical trial assigns patients to a pain scale of 0 (no pain), 1-3 (mild), 4-6
(moderate), or 7-10 (severe). What level of measurement does this pain scale
represent?
A. Nominal
B. Interval
C. Ratio
D. Ordinal [CORRECT]
Correct Answer: D
Rationale: The pain scale has ordered categories (none < mild < moderate < severe), but the
spacing between categories is not necessarily equal — the difference between 'mild' and
'moderate' is not the same as between 'moderate' and 'severe' in measurable terms. This is
ordinal data. Means and standard deviations are technically inappropriate for ordinal data,
though they are sometimes used in practice. Median and IQR are more appropriate. The classic
0-10 numerical pain scale is also typically treated as ordinal (sometimes interval by
convention).
Q4. Which of the following variables is BOTH quantitative and continuous?
A. Blood pressure measured in mmHg [CORRECT]
B. Number of hospital admissions per day (count)
C. Patient marital status
D. Triage acuity level (1, 2, 3, 4, 5)
Correct Answer: A
Rationale: A continuous quantitative variable can take any value within a range (including
decimals) and is measured, not counted. Blood pressure in mmHg (e.g., 122.7 mmHg) fits this
definition. Number of admissions per day is quantitative but discrete (counts — whole
numbers only). Marital status is qualitative (nominal). Triage acuity level is qualitative
(ordinal) — categories with order but not equal spacing.
Q5. A researcher measures body temperature in degrees Celsius. This is an example
of which level of measurement?
A. Nominal
B. Ordinal
C. Interval [CORRECT]
D. Ratio
Correct Answer: C
Rationale: Temperature in Celsius (or Fahrenheit) is interval data: the difference between 36°C
and 37°C is the same as between 37°C and 38°C (equal spacing). However, 0°C is an arbitrary
point (not the absence of heat) — there is no true zero — so 40°C is not 'twice as hot' as 20°C.
Kelvin temperature is ratio because 0 K is absolute zero. OA #1 commonly tests this distinction
by asking students to identify interval vs. ratio for temperature measurements.
Applied Healthcare Statistics
Objective Assessment 1 (OA #1)
100 PRACTICE QUESTIONS WITH DETAILED ANSWERS
Objective Assessment 1 Preparation - Western Governors University
Aligned with 2026-2027 WGU C784 Course Competencies
Comprehensive Step-by-Step Solutions and Healthcare Applications
Total Questions 100 MCQs (4 options, one correct)
Sections 11 competency-aligned content domains
Cognitive Mix 30% recall / 50% application / 20% analysis
Format 60% calculation/application / 40% conceptual
Rationale Depth 2-4 sentences with step-by-step statistical reasoning
WGU C784 | Applied Healthcare Statistics | Z.ai Academic Series Confidential - Educational Use
,WGU C784 - Applied Healthcare Statistics OA #1 - 100 Practice Questions Latest 2026/2027 (Answered)
Examination Overview
Purpose: This 100-question practice examination is designed to prepare students for the WGU
C784 Applied Healthcare Statistics Objective Assessment 1 (OA #1). The questions cover all 11
course competency areas: foundations of statistics and data types; data collection and study
design; descriptive statistics; data visualization; probability fundamentals; Bayes' theorem and
medical test interpretation; probability distributions; sampling distributions and the Central
Limit Theorem; confidence intervals; hypothesis testing; and statistical tests (t-tests, ANOVA,
chi-square, correlation, regression). Each question includes a detailed rationale with
step-by-step statistical reasoning, healthcare application, and OA #1 preparation coaching.
How to use this document: Attempt all 100 questions across the 11 sections. Verify each
answer against the rationale and rework any missed questions. Pay special attention to
calculation-based items (sample variance, z-scores, confidence intervals, Bayes'/PPV/NPV, and
probability rules) and to conceptual distinctions (correlation vs. causation, statistical vs.
clinical significance, sensitivity vs. PPV, Type I vs. Type II errors) — these are highest-yield on
the OA #1.
Section Title Q Range # Qs
Section 1 Introduction to Statistics, Data Types, and Levels of MeasurementQ1-Q11 11
Section 2 Data Collection, Sampling Methods, Bias, and Study Design Q12-Q22 11
Section 3 Descriptive Statistics Q23-Q36 14
Section 4 Data Visualization and Graphical Interpretation Q37-Q44 8
Section 5 Probability Fundamentals Q45-Q54 10
Section 6 Bayes' Theorem and Medical Test Interpretation Q55-Q62 8
Section 7 Probability Distributions Q63-Q72 10
Section 8 Sampling Distributions and the Central Limit Theorem Q73-Q79 7
Section 9 Confidence Intervals for Means and Proportions Q80-Q86 7
Section 10 Hypothesis Testing Q87-Q94 8
Section 11 Statistical Tests Q95-Q100 6
TOTAL 100
WGU C784 OA #1 Page 2 100 Questions
, Section 1: Introduction to Statistics, Data Types, and Levels of Measurement
Descriptive vs. Inferential Statistics, Variable Types, & Levels of Measurement
Q1. A nurse researcher reports the average length of stay (LOS) for 350 patients
discharged from a hospital's cardiac unit last month was 4.7 days, and uses this to
estimate the average LOS for all cardiac patients in the hospital system over the past
year. The first statement (average = 4.7 days) is an example of which type of statistics,
and the second statement (estimating the broader population) is which type?
A. Both are descriptive statistics because both describe data.
B. The average of 4.7 days is descriptive statistics; using it to generalize beyond the
sample to a larger population is inferential statistics. [CORRECT]
C. The average of 4.7 days is inferential statistics; generalizing to the population is
descriptive statistics.
D. Both are inferential statistics because research is being conducted.
Correct Answer: B
Rationale: Descriptive statistics summarize and organize the characteristics of a sample (e.g.,
mean, standard deviation, frequencies). Inferential statistics use sample data to draw
conclusions or make predictions about a larger population (e.g., estimation, hypothesis
testing). The mean LOS of 4.7 days for the 350 patients describes the sample — descriptive.
Using that sample mean to estimate the average LOS for the broader population of cardiac
patients over the past year is inferential. OA #1 frequently tests this distinction by asking
students to classify a given statement.
Q2. A researcher collects data on patient blood types (A, B, AB, O) and Rh status
(positive, negative). Which level of measurement applies to blood type?
A. Ordinal — categories with a meaningful rank order
B. Nominal — categories with no inherent order [CORRECT]
C. Interval — ordered categories with equal spacing and no true zero
D. Ratio — ordered with equal spacing and a true zero
Correct Answer: B
Rationale: Blood type is a nominal variable: categories (A, B, AB, O) are mutually exclusive
labels with no inherent ranking or numeric meaning. Nominal data allow counts and modes
but not means or medians. Ordinal data (e.g., cancer Stage I-IV) have ordered categories
without equal spacing. Interval (e.g., Celsius temperature) has equal spacing but no true zero.
Ratio (e.g., weight, height, LOS) has equal spacing and a true zero — supporting all arithmetic
operations.
, Q3. A clinical trial assigns patients to a pain scale of 0 (no pain), 1-3 (mild), 4-6
(moderate), or 7-10 (severe). What level of measurement does this pain scale
represent?
A. Nominal
B. Interval
C. Ratio
D. Ordinal [CORRECT]
Correct Answer: D
Rationale: The pain scale has ordered categories (none < mild < moderate < severe), but the
spacing between categories is not necessarily equal — the difference between 'mild' and
'moderate' is not the same as between 'moderate' and 'severe' in measurable terms. This is
ordinal data. Means and standard deviations are technically inappropriate for ordinal data,
though they are sometimes used in practice. Median and IQR are more appropriate. The classic
0-10 numerical pain scale is also typically treated as ordinal (sometimes interval by
convention).
Q4. Which of the following variables is BOTH quantitative and continuous?
A. Blood pressure measured in mmHg [CORRECT]
B. Number of hospital admissions per day (count)
C. Patient marital status
D. Triage acuity level (1, 2, 3, 4, 5)
Correct Answer: A
Rationale: A continuous quantitative variable can take any value within a range (including
decimals) and is measured, not counted. Blood pressure in mmHg (e.g., 122.7 mmHg) fits this
definition. Number of admissions per day is quantitative but discrete (counts — whole
numbers only). Marital status is qualitative (nominal). Triage acuity level is qualitative
(ordinal) — categories with order but not equal spacing.
Q5. A researcher measures body temperature in degrees Celsius. This is an example
of which level of measurement?
A. Nominal
B. Ordinal
C. Interval [CORRECT]
D. Ratio
Correct Answer: C
Rationale: Temperature in Celsius (or Fahrenheit) is interval data: the difference between 36°C
and 37°C is the same as between 37°C and 38°C (equal spacing). However, 0°C is an arbitrary
point (not the absence of heat) — there is no true zero — so 40°C is not 'twice as hot' as 20°C.
Kelvin temperature is ratio because 0 K is absolute zero. OA #1 commonly tests this distinction
by asking students to identify interval vs. ratio for temperature measurements.


