
MATH 110 FINAL EXAM QUESTIONS AND ANSWERS- PORTAGE
LEARNING
Final Exam
Question 1
Not yet graded / 10 pts
You may find the following files helpful throughout the exam:
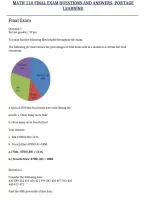
The following pie chart shows the percentages of total items sold in a month in a certain fast food
restaurant.
A total of 4700 fast food items were sold during the
month. a.) How many were fish?
b.) How many were french fries?
Your Answer:
a. fish 4700(0.28)=1316
b. French fries 4700(0.4)=1880
a.) Fish : 4700(.28) = 1316
b.) French Fries: 4700(.40) = 1880
Question 2
Consider the following data:
430 389 414 401 466 421 399 387 450 407 392 410
440 417 471
Find the 40th percentile of this data.
, MATH 110 FINAL EXAM QUESTIONS AND ANSWERS- PORTAGE
LEARNING
There are a total of fifteen numbers, so n= 15. In order to find the percentiles, we must put the
numbers in ascending order:
387 389 392 399 401 407 410 414 417 421 430 440 450 466 471
For the 40th percentile:
Therefore, the 40th percentile index for this data set is the 6th observation. In the list above, the
6th observation is 407.
Question 3
In a tri-state conference, 60% attendees are from California, 25% from Oregon, and 15% from
Washington. As it turns out 6 % of the attendees from California, 17% of the attendees from Oregon, and
12% of the attendees from Washington came to the conference by train. If an attendee is selected at
random and found to have arrived by train, what is the probability that the person is from Washington?
P(Train│C)=.06..
P(Train│O)=.17..
P(Train│W)=.12..
P(C)=.60,P(O)=.25,P(W)=.15.
We want to find P(W│Train), so use:
Question 4
Find each of the following probabilities:
a. Find P(Z ≤ -0.87) .
b. Find P(Z ≥ .93) .
c. Find P(-.59 ≤ Z ≤ -.36).
a.
P(Z ≤ -0.87)= .19215.
LEARNING
Final Exam
Question 1
Not yet graded / 10 pts
You may find the following files helpful throughout the exam:
The following pie chart shows the percentages of total items sold in a month in a certain fast food
restaurant.
A total of 4700 fast food items were sold during the
month. a.) How many were fish?
b.) How many were french fries?
Your Answer:
a. fish 4700(0.28)=1316
b. French fries 4700(0.4)=1880
a.) Fish : 4700(.28) = 1316
b.) French Fries: 4700(.40) = 1880
Question 2
Consider the following data:
430 389 414 401 466 421 399 387 450 407 392 410
440 417 471
Find the 40th percentile of this data.
, MATH 110 FINAL EXAM QUESTIONS AND ANSWERS- PORTAGE
LEARNING
There are a total of fifteen numbers, so n= 15. In order to find the percentiles, we must put the
numbers in ascending order:
387 389 392 399 401 407 410 414 417 421 430 440 450 466 471
For the 40th percentile:
Therefore, the 40th percentile index for this data set is the 6th observation. In the list above, the
6th observation is 407.
Question 3
In a tri-state conference, 60% attendees are from California, 25% from Oregon, and 15% from
Washington. As it turns out 6 % of the attendees from California, 17% of the attendees from Oregon, and
12% of the attendees from Washington came to the conference by train. If an attendee is selected at
random and found to have arrived by train, what is the probability that the person is from Washington?
P(Train│C)=.06..
P(Train│O)=.17..
P(Train│W)=.12..
P(C)=.60,P(O)=.25,P(W)=.15.
We want to find P(W│Train), so use:
Question 4
Find each of the following probabilities:
a. Find P(Z ≤ -0.87) .
b. Find P(Z ≥ .93) .
c. Find P(-.59 ≤ Z ≤ -.36).
a.
P(Z ≤ -0.87)= .19215.


