
Q1.
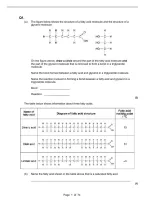
(a) The figure below shows the structure of a fatty acid molecule and the structure of a
glycerol molecule.
On the figure above, draw a circle around the part of the fatty acid molecule and
the part of the glycerol molecule that is removed to form a bond in a triglyceride
molecule.
Name the bond formed between a fatty acid and glycerol in a triglyceride molecule.
Name the reaction involved in forming a bond between a fatty acid and glycerol in a
triglyceride molecule.
Bond ____________________
Reaction _________________
(3)
The table below shows information about three fatty acids.
(b) Name the fatty acid shown in the table above that is a saturated fatty acid.
___________________________________________________________________
(1)
Page 1 of 74
, (c) The melting point is the temperature at which a solid changes state to be a liquid.
Use the table above to describe the relationship between fatty acid structure and
fatty acid melting point.
___________________________________________________________________
___________________________________________________________________
___________________________________________________________________
(1)
(d) The ratio of saturated to unsaturated fatty acids in a cell-surface membrane
determines the extent of the membrane’s fluidity.
Scientists provided a cell culture of mouse phagocytes with liquid broth rich in
unsaturated fatty acids.
The scientists observed:
• an increase in the proportion of phospholipids in the phagocytes containing
unsaturated fatty acids
• more phagocytosis.
Suggest and explain why there was more phagocytosis.
___________________________________________________________________
___________________________________________________________________
___________________________________________________________________
___________________________________________________________________
___________________________________________________________________
___________________________________________________________________
___________________________________________________________________
___________________________________________________________________
___________________________________________________________________
(3)
(Total 8 marks)
Q2.
Omega-3 fatty acids are also found in fish. Scientists investigated the concentration of
omega-3 fatty acids from wild-caught and farmed fish. Their results are shown in the
figure below.
Page 2 of 74
, The bars show standard deviation; n is the sample size.
It is not possible to conclude from the data that the concentration of omega-3 fatty acids
in the farmed salmon is higher than that of the wild salmon. Use the data to explain why.
_______________________________________________________________________
_______________________________________________________________________
_______________________________________________________________________
_______________________________________________________________________
(Total 2 marks)
Q3.
(a) Name the substance that muscles use as their immediate energy source.
___________________________________________________________________
(1)
(b) Sports scientists investigated the change in energy sources used during exercise.
They measured the percentage of energy obtained from carbohydrate and the
percentage of energy obtained from fat in two groups of athletes.
• Group A exercised at different intensities for the same time.
• Group B exercised at the same intensity for different times.
They calculated the intensity of the exercise as a percentage of VO 2 max.
VO2 max is the maximum volume of oxygen the athletes can take in per minute.
The results for Group A are shown in Figure 1 and the results for Group B are
shown in Figure 2.
Figure 1
Page 3 of 74
, Figure 2
(i) Calculate the ratio of the percentage of energy from carbohydrate to the
percentage of energy from fat when the intensity of exercise is 70% VO 2 max.
Show your working.
Answer ___________________________________
(2)
(ii) A person wishes to lose some body fat by exercising. What sort of exercise
would be most effective? Use the information in Figures 1 and 2 to explain
Page 4 of 74


