
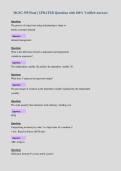
MGSC-395 Final | UPDATED Questions with 100% Verified Answers
Question:
The process of using forecasting and planning to shape or
predict customer demand.
Answer:
demand management
Question:
What is the difference between a dependent and independent
variable in regression?
Answer:
The independent variable (X) predicts the dependent variable (Y).
Question:
What does r² represent in regression output?
Answer:
The percentage of variation in the dependent variable explained by the independent
variable.
Question:
The order quantity that minimizes total ordering + holding cost.
Answer:
EOQ
Question:
Categorizing inventory by value: A = high value, B = medium, C
= low. Based on Pareto (80/20 rule).
Answer:
ABC Analysis
Question:
Difference between P system and Q system?
, Answer:
Q System (Continuous): Order when IP ≤ R. Uses EOQ.
P System (Periodic): Order every P periods; order quantity = T - IP. Requires more safety
stock.
Question:
What is outsourcing analysis based on?
Answer:
Break-even analysis comparing costs of making vs. buying.
Question:
What are external causes of supply chain disruption?
Answer:
Unexpected changes like supplier failures, natural disasters, or labor strikes.
Question:
What are internal causes of disruption?
Answer:
Poor forecasting, poor inventory management, quality issues.
Question:
How do you choose suppliers based on lowest total cost?
Answer:
Compare each supplier's unit cost + ordering cost + inventory carrying cost +
transportation cost
Question:
the most commonforecasted value
Answer:
Demand
Question:
five basic time series patterns
, Answer:
1. Horizontal
2. Trend
3. Seasonal
4. Cyclical
5. Random
Question:
the difference found bysubtracting the forecast from actual
demand for agiven period,
Answer:
forecast error
Question:
• Measures the total forecast error that assesses the bias in a
forecast.
• It is the sum of all errors for a given period.
Answer:
Cumulative Sum of Forecast Errors (CFE)
Question:
Called the mean bias
Answer:
Average Forecast Error
Question:
Relates the forecast error to the level of demand and is useful
for putting forecast performance in the proper perspective
Answer:
Mean Absolute Percent Error (MAPE)
Question:
These forecast errors measure the dispersion of forecast
errorsattributed to trend, seasonal, cyclical, or random
Question:
The process of using forecasting and planning to shape or
predict customer demand.
Answer:
demand management
Question:
What is the difference between a dependent and independent
variable in regression?
Answer:
The independent variable (X) predicts the dependent variable (Y).
Question:
What does r² represent in regression output?
Answer:
The percentage of variation in the dependent variable explained by the independent
variable.
Question:
The order quantity that minimizes total ordering + holding cost.
Answer:
EOQ
Question:
Categorizing inventory by value: A = high value, B = medium, C
= low. Based on Pareto (80/20 rule).
Answer:
ABC Analysis
Question:
Difference between P system and Q system?
, Answer:
Q System (Continuous): Order when IP ≤ R. Uses EOQ.
P System (Periodic): Order every P periods; order quantity = T - IP. Requires more safety
stock.
Question:
What is outsourcing analysis based on?
Answer:
Break-even analysis comparing costs of making vs. buying.
Question:
What are external causes of supply chain disruption?
Answer:
Unexpected changes like supplier failures, natural disasters, or labor strikes.
Question:
What are internal causes of disruption?
Answer:
Poor forecasting, poor inventory management, quality issues.
Question:
How do you choose suppliers based on lowest total cost?
Answer:
Compare each supplier's unit cost + ordering cost + inventory carrying cost +
transportation cost
Question:
the most commonforecasted value
Answer:
Demand
Question:
five basic time series patterns
, Answer:
1. Horizontal
2. Trend
3. Seasonal
4. Cyclical
5. Random
Question:
the difference found bysubtracting the forecast from actual
demand for agiven period,
Answer:
forecast error
Question:
• Measures the total forecast error that assesses the bias in a
forecast.
• It is the sum of all errors for a given period.
Answer:
Cumulative Sum of Forecast Errors (CFE)
Question:
Called the mean bias
Answer:
Average Forecast Error
Question:
Relates the forecast error to the level of demand and is useful
for putting forecast performance in the proper perspective
Answer:
Mean Absolute Percent Error (MAPE)
Question:
These forecast errors measure the dispersion of forecast
errorsattributed to trend, seasonal, cyclical, or random


