
Graph / Chart About Image
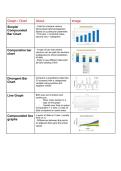
Simple/ - Used to compare various
items/observations/categories
Compounded based on a particular parameter.
Bar Chart - First axis = numerical value,
second axis = categories
Comparative bar - A type of bar chart where
columns can be split into sections
chart (categories) to show breakdown
of data.
- Easy to see different data sets!
all bars totalling 100%
Divergent Bar Compare a quantitative data (like
% increase) with a categorised
Chart variable using positive and
negative values
Line Graph Both axis and numbers and
continuous
- River cross section is a
type of line graph
- Usually over time or space
Comparative = 2 lines ( 2 sets of
data compared on same axes)
Compounded line -Layers of data on 2 axis ( usually
time on x)
graphs - Differences between the points
on adjacent lines give the actual
values


