

1. The following graphSINGLE
gives the variation
SECTION
CHOICE ofQUESTIONS
molar
– I heat capacity ‘C’ as a function of ‘x’
(SINGLE CORRECTx ANSWER TYPE)
where ‘x’ is given by the expression PV = Constant. If gas is mono-atomic what are the
coordinates of P1 and P4 ?
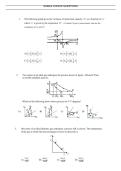
1. The following graph gives the variation of molar heat capacity ‘C’ as a function of ‘x’
where ‘x’ is given by the expression PV x = Constant. If gas is mono-atomic what are the
coordinates of P1 and P4 ?
5 5 3 7
A) 0, R & , 0 B) 0, R & , 0
2 3 2 5
5 7 7 5
C) 0, R & , 0 D) 0, R & , 0
2 5 5 3
5 5 3 7
A) 0, R & , 0 B) 0, R & , 0
2 3 2 5
Sol. A
5 7 7 5
C) 0, R & , 0 D) 0, R & , 0
2 5 5 3
Sol. A
2. Two moles of an ideal gas undergoes the process shown in figure. AB and CD are
reversible adiabatic process.
2. Two moles of an ideal gas undergoes the process shown in figure. AB and CD are
reversible adiabatic process.
Which of the following shows above process on V-T diagram?
A) B) C) D)
Which of the following shows above process on V-T diagram?
Sol. B Isobaric process are straight lines through origin in T v/s V graph.
A) B) C) D)
3. One mole of an ideal diatomic gas undergoes a process AB as shown. The temperature
of the gas at which the heat exchange reverses its direction is
P
P0
A
B
V0 V
7PV 49PV 35PV 25PV
A) 0 0
B) 0 0
C) 0 0
D) 0 0
12R 144R 144R 144R
Sol. C
gives the variation
SECTION
CHOICE ofQUESTIONS
molar
– I heat capacity ‘C’ as a function of ‘x’
(SINGLE CORRECTx ANSWER TYPE)
where ‘x’ is given by the expression PV = Constant. If gas is mono-atomic what are the
coordinates of P1 and P4 ?
1. The following graph gives the variation of molar heat capacity ‘C’ as a function of ‘x’
where ‘x’ is given by the expression PV x = Constant. If gas is mono-atomic what are the
coordinates of P1 and P4 ?
5 5 3 7
A) 0, R & , 0 B) 0, R & , 0
2 3 2 5
5 7 7 5
C) 0, R & , 0 D) 0, R & , 0
2 5 5 3
5 5 3 7
A) 0, R & , 0 B) 0, R & , 0
2 3 2 5
Sol. A
5 7 7 5
C) 0, R & , 0 D) 0, R & , 0
2 5 5 3
Sol. A
2. Two moles of an ideal gas undergoes the process shown in figure. AB and CD are
reversible adiabatic process.
2. Two moles of an ideal gas undergoes the process shown in figure. AB and CD are
reversible adiabatic process.
Which of the following shows above process on V-T diagram?
A) B) C) D)
Which of the following shows above process on V-T diagram?
Sol. B Isobaric process are straight lines through origin in T v/s V graph.
A) B) C) D)
3. One mole of an ideal diatomic gas undergoes a process AB as shown. The temperature
of the gas at which the heat exchange reverses its direction is
P
P0
A
B
V0 V
7PV 49PV 35PV 25PV
A) 0 0
B) 0 0
C) 0 0
D) 0 0
12R 144R 144R 144R
Sol. C


