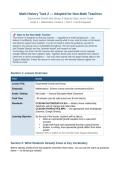
Math History Task 2 — Adapted for Non-Math Teachers
Exponential Growth and Decay: A Step-by-Step Lesson Guide
Grade 8 | Mathematics / Science | Part A + Part B Integrated
📌 Note to the Non-Math Teacher
This lesson is designed so that any teacher — regardless of math background — can
deliver it confidently. Every section includes exactly what to say, what to write on the board,
and what to expect from students. You do not need to solve the problems yourself in
advance; the answer key is embedded throughout. The two tools students use (Desmos
and Google Sheets) are free, browser-based, and require no login.
Technology role (from Part B): Desmos lets students see exponential curves instantly.
Google Sheets lets them organize data. Together these tools move students from passive
observers to active investigators — but only when paired with the paper-based steps in the
Support Materials. Follow the lesson in order and you will naturally balance digital and
hands-on work.
Section 1: Lesson Overview
Field Details
Lesson Title Exponential Growth and Decay
Subject(s) Mathematics / Science (cross-curricular connections built in)
Grade / Setting 8th Grade — General Education Math Classroom
Total Time ~60 minutes (can be split across two 30-min blocks)
Standards CCSS.MATH.CONTENT.8.F.B.4 — Model a linear relationship;
determine rate of change and initial value.
CCSS.MATH.PRACTICE.MP5 — Use appropriate tools strategically
(Desmos, Google Sheets).
Learning Objective By the end of the lesson, students will be able to:
• Write an exponential growth equation from a real-world
scenario
• Graph both linear and exponential functions using Desmos
• Explain, in writing, how exponential growth differs from linear
growth
Mastery: 80% or higher on the exit ticket (see Support Materials).
Section 2: What Students Already Know & Key Vocabulary
Before starting, briefly check that students remember these ideas. You can ask the warm-up questions
below — no formal quiz needed.
, 2a. Prerequisites — Quick Verbal Check
Skill students need Quick question to check it
Read tables and graphs "If I gave you a table with x = 1, 2, 3 and y =
5, 10, 15, what do you notice about how y
changes?"
Multiplication and division "What is 100 × 2? What is 200 × 2?"
Exponents "What does 2³ mean? What is the answer?"
Coordinate graphing (x/y plane) "Where would I plot the point (3, 8) on a
graph?"
Basic Desmos navigation "Has anyone used Desmos before? Open it
on your Chromebook."
2b. Key Vocabulary (from Support Materials)
The Support Materials include a full vocabulary chart to post or distribute. Below are the six most critical
terms with teacher-friendly explanations.
Word Plain-Language Definition Classroom Example to Say Out Loud
Linear Growth Grows by adding the same "Think of saving $50 a week. Week
amount each time. 1: $50, Week 2: $100, Week 3:
$150. Always adding 50."
Exponential Grows by multiplying by the "Think of a chain letter. You send it
Growth same number each time. to 2 friends, each sends to 2 more
— the total explodes."
Function A rule connecting inputs to "Like a vending machine: press B3,
outputs — one input gives always get the same snack."
exactly one output.
Initial Value The starting amount (when x = "In y = 100(2^x), when x = 0, y =
0). 100. We started with 100."
Growth Factor The number you multiply by "In y = 100(2^x), the growth factor is
each time period. 2 — the population doubles every
hour."
Rate of Change How much the output changes "In y = 100 + 50x, the rate of change
per unit of input. is 50 — adds $50 per year."
Section 3: Materials & Technology Setup
Physical Materials Technology (Pre-check before class)
• Student Chromebooks (1 per student • Open desmos.com/calculator on your
or pair) display screen before class
Exponential Growth and Decay: A Step-by-Step Lesson Guide
Grade 8 | Mathematics / Science | Part A + Part B Integrated
📌 Note to the Non-Math Teacher
This lesson is designed so that any teacher — regardless of math background — can
deliver it confidently. Every section includes exactly what to say, what to write on the board,
and what to expect from students. You do not need to solve the problems yourself in
advance; the answer key is embedded throughout. The two tools students use (Desmos
and Google Sheets) are free, browser-based, and require no login.
Technology role (from Part B): Desmos lets students see exponential curves instantly.
Google Sheets lets them organize data. Together these tools move students from passive
observers to active investigators — but only when paired with the paper-based steps in the
Support Materials. Follow the lesson in order and you will naturally balance digital and
hands-on work.
Section 1: Lesson Overview
Field Details
Lesson Title Exponential Growth and Decay
Subject(s) Mathematics / Science (cross-curricular connections built in)
Grade / Setting 8th Grade — General Education Math Classroom
Total Time ~60 minutes (can be split across two 30-min blocks)
Standards CCSS.MATH.CONTENT.8.F.B.4 — Model a linear relationship;
determine rate of change and initial value.
CCSS.MATH.PRACTICE.MP5 — Use appropriate tools strategically
(Desmos, Google Sheets).
Learning Objective By the end of the lesson, students will be able to:
• Write an exponential growth equation from a real-world
scenario
• Graph both linear and exponential functions using Desmos
• Explain, in writing, how exponential growth differs from linear
growth
Mastery: 80% or higher on the exit ticket (see Support Materials).
Section 2: What Students Already Know & Key Vocabulary
Before starting, briefly check that students remember these ideas. You can ask the warm-up questions
below — no formal quiz needed.
, 2a. Prerequisites — Quick Verbal Check
Skill students need Quick question to check it
Read tables and graphs "If I gave you a table with x = 1, 2, 3 and y =
5, 10, 15, what do you notice about how y
changes?"
Multiplication and division "What is 100 × 2? What is 200 × 2?"
Exponents "What does 2³ mean? What is the answer?"
Coordinate graphing (x/y plane) "Where would I plot the point (3, 8) on a
graph?"
Basic Desmos navigation "Has anyone used Desmos before? Open it
on your Chromebook."
2b. Key Vocabulary (from Support Materials)
The Support Materials include a full vocabulary chart to post or distribute. Below are the six most critical
terms with teacher-friendly explanations.
Word Plain-Language Definition Classroom Example to Say Out Loud
Linear Growth Grows by adding the same "Think of saving $50 a week. Week
amount each time. 1: $50, Week 2: $100, Week 3:
$150. Always adding 50."
Exponential Grows by multiplying by the "Think of a chain letter. You send it
Growth same number each time. to 2 friends, each sends to 2 more
— the total explodes."
Function A rule connecting inputs to "Like a vending machine: press B3,
outputs — one input gives always get the same snack."
exactly one output.
Initial Value The starting amount (when x = "In y = 100(2^x), when x = 0, y =
0). 100. We started with 100."
Growth Factor The number you multiply by "In y = 100(2^x), the growth factor is
each time period. 2 — the population doubles every
hour."
Rate of Change How much the output changes "In y = 100 + 50x, the rate of change
per unit of input. is 50 — adds $50 per year."
Section 3: Materials & Technology Setup
Physical Materials Technology (Pre-check before class)
• Student Chromebooks (1 per student • Open desmos.com/calculator on your
or pair) display screen before class