Solutions to Practice Midterm Exam
LS 40
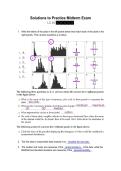
1. Write the letters of the plots in the left panels below that match each of the plots in the
right panels. Then answer questions a-e below.
2. The first step to responsible data analysis is to visualize the raw data .
3. The median and mean are measures of the central tendency of the data, while the
MADAM and standard deviation are measures of the spread/variability .
, 4. Use the data below, which are lengths in mm, to answer the following questions:
[86,95,97,99,100,102,104,105,106,106,109,113,113,125]
a. Calculate the median.
Since we have 14 numbers, the median is the average of the 7th and 8th values
when sorted from minimum to maximum as shown below. Thus, the median is
104.5.
[86,95,97,99,100,102,104,||105,106,106,109,113,113,125]
b. Calculate the MADAM.
Calculate absolute deviations from median by subtracting the median from each
data value and taking absolute value of those. Absolute values of deviations are
[18.5,9.5,7.5,5.5,4.5,2.5,0.5,0.5,1.5,1.5,4.5,8.5,8.5,20.5]. The MADAM (median
of those absolute deviations) is 5.
Note: if you want more practice on this, make up your own list of numbers
(shorter is fine!) and confirm your answer using the Python function we wrote in
Homework 2 Solutions!
c. Complete the histogram below by drawing the heights for each provided bin.
d. Label both axes and indicate the median on the graph.
Note: Your histogram might look a little different if you included the minimum part of
each bin rather than the maximum. Either is fine. It’s probably a good idea to include a
title or caption too, but the title for this would be really boring like “Histogram of Lengths”
so we didn’t ask for it.
5. “We compared two groups and calculated p = 0.2, so there is no difference between the
two groups.” Is this interpretation correct? Justify your answer.
LS 40
1. Write the letters of the plots in the left panels below that match each of the plots in the
right panels. Then answer questions a-e below.
2. The first step to responsible data analysis is to visualize the raw data .
3. The median and mean are measures of the central tendency of the data, while the
MADAM and standard deviation are measures of the spread/variability .
, 4. Use the data below, which are lengths in mm, to answer the following questions:
[86,95,97,99,100,102,104,105,106,106,109,113,113,125]
a. Calculate the median.
Since we have 14 numbers, the median is the average of the 7th and 8th values
when sorted from minimum to maximum as shown below. Thus, the median is
104.5.
[86,95,97,99,100,102,104,||105,106,106,109,113,113,125]
b. Calculate the MADAM.
Calculate absolute deviations from median by subtracting the median from each
data value and taking absolute value of those. Absolute values of deviations are
[18.5,9.5,7.5,5.5,4.5,2.5,0.5,0.5,1.5,1.5,4.5,8.5,8.5,20.5]. The MADAM (median
of those absolute deviations) is 5.
Note: if you want more practice on this, make up your own list of numbers
(shorter is fine!) and confirm your answer using the Python function we wrote in
Homework 2 Solutions!
c. Complete the histogram below by drawing the heights for each provided bin.
d. Label both axes and indicate the median on the graph.
Note: Your histogram might look a little different if you included the minimum part of
each bin rather than the maximum. Either is fine. It’s probably a good idea to include a
title or caption too, but the title for this would be really boring like “Histogram of Lengths”
so we didn’t ask for it.
5. “We compared two groups and calculated p = 0.2, so there is no difference between the
two groups.” Is this interpretation correct? Justify your answer.