

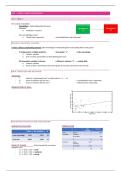
HS5 – SIMPLE LINEAR REGRESSION
HC 9 : DEEL 1
Eén vd doel vd statistiek
- Voorspellen v toekomstige gebeurtenissen
- Synoniem
o Prediction = forecast
- Hoe voorspellingen doen?
o Simple linear regression = eenvoudig lineair regressiemodel
RESEARCH QUESTION: EXAMPLE
Is there a (linear) relationship between letter knowledge in third kindergarten and reading skills in first grade?
- IV (independent variable)/predictor: = Voorspeller “x” = letter knowledge
o Numeric variable
o # of correctly named letters in third kindergarten class
- DV (dependent variable) /criterion: = Uitkomst/ criterium “y” = reading skills
o Numeric variable
o Score on Brus's One Minute Test in first grade: # correctly read words in one minute
DATA STRUCTURE AND NOTATION
NOTATION :
- i: index for "experimental unit" or observation (i = 1, ..., n)
- Xi : score on predictor (IV) for unit i = voorspellende score v observatie
- Yi : score on criterion (DV) for unit i = uitkomstscore v observatie
PRESENTATION OF DATA
60
50
score op één minuut test
40
30
20
10
0
0 5 10 15 20 25 30
letterkennis
DESCRIPTIVE STATISTICS AND VISIALIZATION
DESCRIPTIVE STATISTICS CORRELATIONS
RULES OF THUMB We learned this in previous
statistics cours
- |rXY |= 0.00 - 0.20 → weak
- |rXY |= 0.20 - 0.40 → moderate
- |rXY |= 0.40 - 1.00 → strong
,THE SIMPLE LINEAR REGRESSION MODEL, ASSUMPTIONS AND INTERPRETATIONS
SIMPLE LINEAR REGRESSION POPULATION-MODEL
i.i.d.
Y i=β 0 + β 1 X i+ ε i , ε i ∼ N (0 , σ 2 )
o Elke geobserveerde waarde bestaat uit:
Systematisch deel
= Datgene dat het model “verklaart”
= (β0+β1Xi)
Toevallig deel
= Datgene wat niet perfect verklaard wordt
= εi = ERROR
o = Alle invloeden die niet in het model zitten
o Aannames/assumptions v foutterm
Gemiddeld = 0
Zijn normaal verdeeld
Hebben dezelfde variantie voor alle x -waarden
Zijn onafhankelijk
- WAT IS DE REGRESSIELIJN EIGENLIJK?
o Omdat E(ε i )=0 , geldt: E(Y i ∣ X i)= β0 + β 1 X i
o = Voorwaardelijke/conditioneel gemiddelde waarde van Y ALS X gegeven is
o De regressielijn beschrijft dus
NIET: elk individueel punt exact
WEL: het gemiddelde van Y voor een gegeven X
o Bijvoorbeeld:
voor een bepaald jaar geeft lijn de verwachte wintijd ≠ noodzakelijk de exacte werkelijke tijd
Interpretation of parameters or regression coefficiënts
- β 0 = b 0: intercept
o = Expected value of Y if X equals 0
o E(Y∣X=0)
o Visueel zichtbaar in grafiek
Punt waar regressielijn y-as kruist
o Aandachtspunt
Intercept is vaak WEL correct als modelparameter
Intercept is NIET altijd zinvol interpreteerbaar
- β 1 = b 1: slope, regression weight = Helling
o = Expected change in Y for unit increase of X
o E(Y∣X=x+1) − E(Y∣X=x) = β1
Als β 1> 0, stijgt Y als X stijgt Positieve samenhang
Als β 1< 0, daalt Y als X stijgt Negatieve samenhang
Als β 1=0 , is er geen lineair verband
READING COMPREHENSION EXAMPLE :
35
- Suppose that in population 0 = 15 and 1 =.5
- Graphical representation of the population model = 30
score op één minuut test
25
20
- Interpretation of parameters or regression coefficients 15
o β 0 = intercept = 15 10
= For score of 0 on letter knowledge the expected 5
reading ability in the population is 15 0
0 5 10 15 20 25 30
letterkennis
, o β 1 = slope = 0.5
= For every 1 point increase in letter knowledge, expected reading ability increases by .5 point
OEFENING
- Which statement is incorrect about this scatter plot?
- A) Every year you get older, expect to add 0.32 best friends.
- B) For a newborn, we predict about 2.5 best friends.
- C) The expected number of best friends for a 10-year-old is about 5.
- D) We see a positive increasing correlation: higher age occurs more often together with
more best friends.
B = FOUT: For a newborn, we predict about 1.65 best friends
ATTENTION POINT
Associatie ≠ automatisch causaliteit
- β 1 heeft meestal GEEN causale interpretatie
o Als je vindt: hoger x hangt samen met hoger/lager y dan mag je alleen zeggen: er is associatie
Niet: x veroorzaakt y
- Waarom niet?
o Omdat er mogelijk een derde variabele z bestaat die beide beïnvloedt.
Causaliteit mag alleen sterk geclaimd worden als onderzoeksdesign dat toelaat
Bv. bij randomisatie
Residuen
- = Geobserveerde waarde - voorspelde waarde geeft error/fout weer op SP-niveau = SS error
- Meet Goodness of fit vh model
- Interpretatie:
o Positief residu: observatie ligt boven de lijn
o Negatief residu: observatie ligt onder de lijn
- Wrm belangrijk/ essentieel?:
o Het beoordeelt de model fit
Kleine residuen goede voorspelling
Grote residuen slechte voorspelling
o Het controleer aannames
o Het detecteerd uitbijters/uitschieters
- Betekenis voor regressielijn
o Regressielijn ≠ alleen een lijn
o Regressielijn produceert OOK verzameling residuen en juist die residuen vertellen of model betrouwbaar is
o Residu = verticale afstand ve punt tot de regressielijn
- Residu en foutterm
o = Sterk verwant maar niet identiek
Foutterm = theoretisch/populatie
Residu = wat je in je steekproef werkelijk uitrekent
STATISTICAL INFERENCE
WHAT INFERENCES (CONCLUSIES) CAN WE MAKE FROM LINEAR REGRESSION MODEL ?
- Inference for the slope = helling
- Inference for the intercept
, - inference on expected value for Y given a certain value for X
we limit ourselves to most important inference: inference for the slope
HC 9 : DEEL 1
Eén vd doel vd statistiek
- Voorspellen v toekomstige gebeurtenissen
- Synoniem
o Prediction = forecast
- Hoe voorspellingen doen?
o Simple linear regression = eenvoudig lineair regressiemodel
RESEARCH QUESTION: EXAMPLE
Is there a (linear) relationship between letter knowledge in third kindergarten and reading skills in first grade?
- IV (independent variable)/predictor: = Voorspeller “x” = letter knowledge
o Numeric variable
o # of correctly named letters in third kindergarten class
- DV (dependent variable) /criterion: = Uitkomst/ criterium “y” = reading skills
o Numeric variable
o Score on Brus's One Minute Test in first grade: # correctly read words in one minute
DATA STRUCTURE AND NOTATION
NOTATION :
- i: index for "experimental unit" or observation (i = 1, ..., n)
- Xi : score on predictor (IV) for unit i = voorspellende score v observatie
- Yi : score on criterion (DV) for unit i = uitkomstscore v observatie
PRESENTATION OF DATA
60
50
score op één minuut test
40
30
20
10
0
0 5 10 15 20 25 30
letterkennis
DESCRIPTIVE STATISTICS AND VISIALIZATION
DESCRIPTIVE STATISTICS CORRELATIONS
RULES OF THUMB We learned this in previous
statistics cours
- |rXY |= 0.00 - 0.20 → weak
- |rXY |= 0.20 - 0.40 → moderate
- |rXY |= 0.40 - 1.00 → strong
,THE SIMPLE LINEAR REGRESSION MODEL, ASSUMPTIONS AND INTERPRETATIONS
SIMPLE LINEAR REGRESSION POPULATION-MODEL
i.i.d.
Y i=β 0 + β 1 X i+ ε i , ε i ∼ N (0 , σ 2 )
o Elke geobserveerde waarde bestaat uit:
Systematisch deel
= Datgene dat het model “verklaart”
= (β0+β1Xi)
Toevallig deel
= Datgene wat niet perfect verklaard wordt
= εi = ERROR
o = Alle invloeden die niet in het model zitten
o Aannames/assumptions v foutterm
Gemiddeld = 0
Zijn normaal verdeeld
Hebben dezelfde variantie voor alle x -waarden
Zijn onafhankelijk
- WAT IS DE REGRESSIELIJN EIGENLIJK?
o Omdat E(ε i )=0 , geldt: E(Y i ∣ X i)= β0 + β 1 X i
o = Voorwaardelijke/conditioneel gemiddelde waarde van Y ALS X gegeven is
o De regressielijn beschrijft dus
NIET: elk individueel punt exact
WEL: het gemiddelde van Y voor een gegeven X
o Bijvoorbeeld:
voor een bepaald jaar geeft lijn de verwachte wintijd ≠ noodzakelijk de exacte werkelijke tijd
Interpretation of parameters or regression coefficiënts
- β 0 = b 0: intercept
o = Expected value of Y if X equals 0
o E(Y∣X=0)
o Visueel zichtbaar in grafiek
Punt waar regressielijn y-as kruist
o Aandachtspunt
Intercept is vaak WEL correct als modelparameter
Intercept is NIET altijd zinvol interpreteerbaar
- β 1 = b 1: slope, regression weight = Helling
o = Expected change in Y for unit increase of X
o E(Y∣X=x+1) − E(Y∣X=x) = β1
Als β 1> 0, stijgt Y als X stijgt Positieve samenhang
Als β 1< 0, daalt Y als X stijgt Negatieve samenhang
Als β 1=0 , is er geen lineair verband
READING COMPREHENSION EXAMPLE :
35
- Suppose that in population 0 = 15 and 1 =.5
- Graphical representation of the population model = 30
score op één minuut test
25
20
- Interpretation of parameters or regression coefficients 15
o β 0 = intercept = 15 10
= For score of 0 on letter knowledge the expected 5
reading ability in the population is 15 0
0 5 10 15 20 25 30
letterkennis
, o β 1 = slope = 0.5
= For every 1 point increase in letter knowledge, expected reading ability increases by .5 point
OEFENING
- Which statement is incorrect about this scatter plot?
- A) Every year you get older, expect to add 0.32 best friends.
- B) For a newborn, we predict about 2.5 best friends.
- C) The expected number of best friends for a 10-year-old is about 5.
- D) We see a positive increasing correlation: higher age occurs more often together with
more best friends.
B = FOUT: For a newborn, we predict about 1.65 best friends
ATTENTION POINT
Associatie ≠ automatisch causaliteit
- β 1 heeft meestal GEEN causale interpretatie
o Als je vindt: hoger x hangt samen met hoger/lager y dan mag je alleen zeggen: er is associatie
Niet: x veroorzaakt y
- Waarom niet?
o Omdat er mogelijk een derde variabele z bestaat die beide beïnvloedt.
Causaliteit mag alleen sterk geclaimd worden als onderzoeksdesign dat toelaat
Bv. bij randomisatie
Residuen
- = Geobserveerde waarde - voorspelde waarde geeft error/fout weer op SP-niveau = SS error
- Meet Goodness of fit vh model
- Interpretatie:
o Positief residu: observatie ligt boven de lijn
o Negatief residu: observatie ligt onder de lijn
- Wrm belangrijk/ essentieel?:
o Het beoordeelt de model fit
Kleine residuen goede voorspelling
Grote residuen slechte voorspelling
o Het controleer aannames
o Het detecteerd uitbijters/uitschieters
- Betekenis voor regressielijn
o Regressielijn ≠ alleen een lijn
o Regressielijn produceert OOK verzameling residuen en juist die residuen vertellen of model betrouwbaar is
o Residu = verticale afstand ve punt tot de regressielijn
- Residu en foutterm
o = Sterk verwant maar niet identiek
Foutterm = theoretisch/populatie
Residu = wat je in je steekproef werkelijk uitrekent
STATISTICAL INFERENCE
WHAT INFERENCES (CONCLUSIES) CAN WE MAKE FROM LINEAR REGRESSION MODEL ?
- Inference for the slope = helling
- Inference for the intercept
, - inference on expected value for Y given a certain value for X
we limit ourselves to most important inference: inference for the slope


