

HS 1. THE DATA ANALYSIS WORKFLOW: AN ILLUSTRATION
BIJLES: HERHALING HYPOTHESE TOETSING
STATISTIEK PROBEERT ALTIJD 1 VRAAG TE BEANTWOORDEN :
- Zien we een echt effect in de wereld, of is dit gewoon toeval?
- Je hebt altijd:
o Data (steekproef) → wat je observeert
o Populatie (onbekend) → wat je wil weten
o Jij ziet bijvoorbeeld: gemiddelde depressiescore per groep
o Maar je wil weten: zijn die verschillen echt of gewoon toeval?
HYPOTHESETOETSING
Stap 1:
- H0: μ = 3
- H1: μ ≠ 3
- !! Altijd populatiesymbolen want je bent iets over populatie aan het testen GEEN SP-symbolen gebruiken
- Dit is tweezijdige test want “≠” symbool !! Eenzijdig heeft symbolen “</>”
< = eenzijdig links
> = eenzijdig rechts
Stap 2:
- Z-test: als sigma gekend is
- T-test: als sigma ongekens is moeten w SP-standaardafwijking (s) berekenen df = n-1
- Alpha = signifanctie niveau
o Als x in dat gebied ligt H0 verwerpen
- Methodes
o 1) Als absolute waarde vd testwaarde >/= aan kritieke waarde H0 verwerpen
o 2) Als p-waarde </= alpha H0 verwerpen
!!! when p-value is low null hypotheses has to go
!!! when p-value is big null hypotheses has to stick
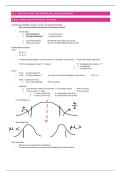
Tweezijdige test
Eenzijdige test
TEST-WAARDE
- Bekom je door toetsstatistiek te berekenen
- p-waarde hoort bij die test-waarde vd toetsstatistiek die je hebt berekend
, P-WAARDE BIJ TWEEZIJDIGE TEST
- p-waarde = 2X opp. vd kleinste staart
P-WAARDE BIJ EENZIJDIGE TEST
- Links: p-waarde = opp. vd linkse staart
- Rechts: p-waarde = opp. vd rechtse staart
!!! verdeling in tabellen zijn symmetrisch kan je dus altijd spiegelen
!!! WRM HYPOTHESE TOETSEN?
- Het is niet omdat je tussen SP -gemiddelde een verschil vindt dat dit ook effectief zo is op populatie – niveau
o Verschil in SP-gemiddelde kan toevallig zijn
o Verschil in SP-gemiddelde kan statistisch significant zijn daarvoor moeten we hypothese test uitvoeren
Type 1 fout: onterecht H0 verwerpen p(H0 verwerpt / H0 WEL waar is)
Type 2 fout onterecht H0 niet verwerpt p(H0 NIET verwerpt / H0 WEL FOUT is)
Verwerpen NIET verwerpen H0 verwerpen Type 1 fout = alpha
H0 juist Type 1 fout Betrouwbaarheid H0 juist
Betrouwbaarheid = 1
H0 NIET verwerpen
H0 fout Power Type 2 fout - alpha
hypothese
Power /
H0 verwerpen onderscheidingsverm
ogen
H0 fout
F-VERDELING H0 NIET verwerpen
Type 2 fout = 1 -
power
Anders dan normaalverdeling EN t-verdeling
t-verdeling
- Omdat t-verdeling symmetrisch is rond 0 kun je dus links, rechts of aan beide kanten toetsen.
f-verdeling
- Is rechtsscheef
- Reden:
o F-waarden zijn altijd positief (≥ 0).
o Verdeling ≠ symmetrisch en heeft alleen rechterstaart.
o Je test of de variantie groter is dan verwacht.
Heeft df1 (df vd teller) en df2 (df vd noemer)
p-waarde ve F-verdeling ligt ALTIJD in rechterstaart
H0: = reduced model
H1 = full model
BI/ CI
Wat?
- BI = betrouwbarheidsinterval = CI = confidance interval
Interpretatie ve BI/CI (bv. 95% BI)
- !! Bij BI mag je nooit spreken over kansen
o 95% gaat niet over kans
Kans dat popu gemiddelde in BI ligt is 0 of 1 ligt er WEL of NIET in MAAR Weet je niet
o 95% gaat wel over betrouwbaarheid vd methode
95% gaat over methode die bepaalde zekerheid geeft dat werkelijke mu in het BI ligt
Als 100 onderzoeken 100 BI opstellen 95 vd BI gaan werkelijk popu- X bevatten en 5 niet
o SP X om BI op te stellen is gemiddelde v som vd grenswaarde v BI
O Als je kritieke waarde nog zelf moet berekenen BI is altijd tweezijdig
BIJLES: HERHALING HYPOTHESE TOETSING
STATISTIEK PROBEERT ALTIJD 1 VRAAG TE BEANTWOORDEN :
- Zien we een echt effect in de wereld, of is dit gewoon toeval?
- Je hebt altijd:
o Data (steekproef) → wat je observeert
o Populatie (onbekend) → wat je wil weten
o Jij ziet bijvoorbeeld: gemiddelde depressiescore per groep
o Maar je wil weten: zijn die verschillen echt of gewoon toeval?
HYPOTHESETOETSING
Stap 1:
- H0: μ = 3
- H1: μ ≠ 3
- !! Altijd populatiesymbolen want je bent iets over populatie aan het testen GEEN SP-symbolen gebruiken
- Dit is tweezijdige test want “≠” symbool !! Eenzijdig heeft symbolen “</>”
< = eenzijdig links
> = eenzijdig rechts
Stap 2:
- Z-test: als sigma gekend is
- T-test: als sigma ongekens is moeten w SP-standaardafwijking (s) berekenen df = n-1
- Alpha = signifanctie niveau
o Als x in dat gebied ligt H0 verwerpen
- Methodes
o 1) Als absolute waarde vd testwaarde >/= aan kritieke waarde H0 verwerpen
o 2) Als p-waarde </= alpha H0 verwerpen
!!! when p-value is low null hypotheses has to go
!!! when p-value is big null hypotheses has to stick
Tweezijdige test
Eenzijdige test
TEST-WAARDE
- Bekom je door toetsstatistiek te berekenen
- p-waarde hoort bij die test-waarde vd toetsstatistiek die je hebt berekend
, P-WAARDE BIJ TWEEZIJDIGE TEST
- p-waarde = 2X opp. vd kleinste staart
P-WAARDE BIJ EENZIJDIGE TEST
- Links: p-waarde = opp. vd linkse staart
- Rechts: p-waarde = opp. vd rechtse staart
!!! verdeling in tabellen zijn symmetrisch kan je dus altijd spiegelen
!!! WRM HYPOTHESE TOETSEN?
- Het is niet omdat je tussen SP -gemiddelde een verschil vindt dat dit ook effectief zo is op populatie – niveau
o Verschil in SP-gemiddelde kan toevallig zijn
o Verschil in SP-gemiddelde kan statistisch significant zijn daarvoor moeten we hypothese test uitvoeren
Type 1 fout: onterecht H0 verwerpen p(H0 verwerpt / H0 WEL waar is)
Type 2 fout onterecht H0 niet verwerpt p(H0 NIET verwerpt / H0 WEL FOUT is)
Verwerpen NIET verwerpen H0 verwerpen Type 1 fout = alpha
H0 juist Type 1 fout Betrouwbaarheid H0 juist
Betrouwbaarheid = 1
H0 NIET verwerpen
H0 fout Power Type 2 fout - alpha
hypothese
Power /
H0 verwerpen onderscheidingsverm
ogen
H0 fout
F-VERDELING H0 NIET verwerpen
Type 2 fout = 1 -
power
Anders dan normaalverdeling EN t-verdeling
t-verdeling
- Omdat t-verdeling symmetrisch is rond 0 kun je dus links, rechts of aan beide kanten toetsen.
f-verdeling
- Is rechtsscheef
- Reden:
o F-waarden zijn altijd positief (≥ 0).
o Verdeling ≠ symmetrisch en heeft alleen rechterstaart.
o Je test of de variantie groter is dan verwacht.
Heeft df1 (df vd teller) en df2 (df vd noemer)
p-waarde ve F-verdeling ligt ALTIJD in rechterstaart
H0: = reduced model
H1 = full model
BI/ CI
Wat?
- BI = betrouwbarheidsinterval = CI = confidance interval
Interpretatie ve BI/CI (bv. 95% BI)
- !! Bij BI mag je nooit spreken over kansen
o 95% gaat niet over kans
Kans dat popu gemiddelde in BI ligt is 0 of 1 ligt er WEL of NIET in MAAR Weet je niet
o 95% gaat wel over betrouwbaarheid vd methode
95% gaat over methode die bepaalde zekerheid geeft dat werkelijke mu in het BI ligt
Als 100 onderzoeken 100 BI opstellen 95 vd BI gaan werkelijk popu- X bevatten en 5 niet
o SP X om BI op te stellen is gemiddelde v som vd grenswaarde v BI
O Als je kritieke waarde nog zelf moet berekenen BI is altijd tweezijdig


