

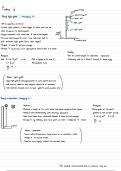
Finding 'g' voltage supply
low
-
electromagnet
Using light gates :
-
changing 'h
D
steel ball
· ↳
#
*
-Set up apparatus as shown
light gate
h
Connect
light gates to a data
logger & place first one as
-
o 7 light gate
close as
you can to electromagnet
counter
height measured with meter rule & use of set square
weighth
-
turn off electromagnet & note time taken for ball to
↑
cushion/pad
fall between light gates (from data logger)
-
Repeat 5 times & take an
average
'h'
Change by lower light gate . Have at least S h values
-
moving up .
Safety :
Analysis -
Use of counterweight to stabilise equipment
use Sut +Lat ,
u =
o
.
Plot a
graph of 2h over Eh, -
Cushioning ball so it doesn't bounceI cause
injury
tat
-
S = the gradient is 'g'
25
( (
Notes :
light gates
Upper light gate at unchanged position so same speed each time
-
-
ball must be dense to help mitigate effects of air resistance
ruler could be clamped to avoid
next to light gates parallax er ror
-
Using a stopwatch -
changing h
Method Analysis
↳
~ : :
=
Measure height 1m with meter rule, ensure upright with set Plota graph of 2h E3,
·
of square over
-
a
=
= -
Release ball
simultaneously with
starting stopwatch gradient of line of best fit is 'g' .
=
-
-
Note time taken from stopwatch Repeat .
5 times to find average s = ut +
katz(u 0) =
Change'h' by releasing from lower point ruler different 'h' values
↳
- 5
-
on -
-
=
a
: cushion
( (
Notes :
stopwatch
-
tennis ball will experience large amount of air resistance -
could
change it to improve results
-
Reaction time hugely affects the recorded times
-
1st method more accurate and is easier to out
, carry
, Terminal Velocity
:
tube
-
long plastic
-
-Wrap elastic bands around the tube at set intervals measured by a ruler
bands to mark distance
--elastic -
drop the ball into the tube & record time taken for it to reach each band Clap feature
Ide
-
-
Repeat 5 times to find average time for each distance
Idn -
Use a
strong magnet to remove the ball
Analysis :
Safety : -Use s= for each distance
along tube .
V
Use fluid that doesn't Plot speed against time
viscous cause
graphs of
-
a a
-
.
skin irritation terminal
velocity is the
velocity
-
to which
graph tends (constant
t
Notes :
Using a
longer tube allows object to travel
at terminal velocity for
longer
-
Using larger spaces between elastic bands
improves accuracy
.
Stopping distance & initial speed : -Set up apparatus as shown , attach a
piece of card to the block/ trolley
Release from different points along the ramp change the
car or
angle
-
,
at which the ramp is
·
.
·
-
The
light gates will record the time taken . v
=
Use ruler to determine
stopping distance
-
a
lo 11 . . . . . . . . . 11111111111111111
-
Repeat for a
range of
initial velocities
Analysis :
Plot (d) & U
a
graph of stopping distance
·
A
straight line
through the origin because All Ex thermal
d/m energy
En of object
=
Emu v' L
Stopping distance
Work done
by friction =
force x
stopping distance
u2/S ?
Determining Young Modulus
roer
↓ t
clamp
Measure
xG- wire
pulley
diameter of wire with a micrometer,
along multiple points &
-
ih
blocks
take
average
wooden
, , , , , ,
,,,,,,,,,
-
Place a marker on wire at Ocm
work berant
Measure length from wooden blocks to marker
-
-
Weigh masses with scale & attach to the end of the wire
7
-Calculate extension for each
weight (new length of marker -
original length) Analysis :
masses
-
Repeat for 7 different masses -
Calculate a re a
using diameter :
(
stress
-
Calculate Stress : (F =
mg)
/Pa
Safety
X
: -
Calculate strain :
Z
MUST goggles plot strain , E
wear incase wire snaps graph stress against the
gradient
-
-
a
of is
-
place a cushion under masses
Strain
low
-
electromagnet
Using light gates :
-
changing 'h
D
steel ball
· ↳
#
*
-Set up apparatus as shown
light gate
h
Connect
light gates to a data
logger & place first one as
-
o 7 light gate
close as
you can to electromagnet
counter
height measured with meter rule & use of set square
weighth
-
turn off electromagnet & note time taken for ball to
↑
cushion/pad
fall between light gates (from data logger)
-
Repeat 5 times & take an
average
'h'
Change by lower light gate . Have at least S h values
-
moving up .
Safety :
Analysis -
Use of counterweight to stabilise equipment
use Sut +Lat ,
u =
o
.
Plot a
graph of 2h over Eh, -
Cushioning ball so it doesn't bounceI cause
injury
tat
-
S = the gradient is 'g'
25
( (
Notes :
light gates
Upper light gate at unchanged position so same speed each time
-
-
ball must be dense to help mitigate effects of air resistance
ruler could be clamped to avoid
next to light gates parallax er ror
-
Using a stopwatch -
changing h
Method Analysis
↳
~ : :
=
Measure height 1m with meter rule, ensure upright with set Plota graph of 2h E3,
·
of square over
-
a
=
= -
Release ball
simultaneously with
starting stopwatch gradient of line of best fit is 'g' .
=
-
-
Note time taken from stopwatch Repeat .
5 times to find average s = ut +
katz(u 0) =
Change'h' by releasing from lower point ruler different 'h' values
↳
- 5
-
on -
-
=
a
: cushion
( (
Notes :
stopwatch
-
tennis ball will experience large amount of air resistance -
could
change it to improve results
-
Reaction time hugely affects the recorded times
-
1st method more accurate and is easier to out
, carry
, Terminal Velocity
:
tube
-
long plastic
-
-Wrap elastic bands around the tube at set intervals measured by a ruler
bands to mark distance
--elastic -
drop the ball into the tube & record time taken for it to reach each band Clap feature
Ide
-
-
Repeat 5 times to find average time for each distance
Idn -
Use a
strong magnet to remove the ball
Analysis :
Safety : -Use s= for each distance
along tube .
V
Use fluid that doesn't Plot speed against time
viscous cause
graphs of
-
a a
-
.
skin irritation terminal
velocity is the
velocity
-
to which
graph tends (constant
t
Notes :
Using a
longer tube allows object to travel
at terminal velocity for
longer
-
Using larger spaces between elastic bands
improves accuracy
.
Stopping distance & initial speed : -Set up apparatus as shown , attach a
piece of card to the block/ trolley
Release from different points along the ramp change the
car or
angle
-
,
at which the ramp is
·
.
·
-
The
light gates will record the time taken . v
=
Use ruler to determine
stopping distance
-
a
lo 11 . . . . . . . . . 11111111111111111
-
Repeat for a
range of
initial velocities
Analysis :
Plot (d) & U
a
graph of stopping distance
·
A
straight line
through the origin because All Ex thermal
d/m energy
En of object
=
Emu v' L
Stopping distance
Work done
by friction =
force x
stopping distance
u2/S ?
Determining Young Modulus
roer
↓ t
clamp
Measure
xG- wire
pulley
diameter of wire with a micrometer,
along multiple points &
-
ih
blocks
take
average
wooden
, , , , , ,
,,,,,,,,,
-
Place a marker on wire at Ocm
work berant
Measure length from wooden blocks to marker
-
-
Weigh masses with scale & attach to the end of the wire
7
-Calculate extension for each
weight (new length of marker -
original length) Analysis :
masses
-
Repeat for 7 different masses -
Calculate a re a
using diameter :
(
stress
-
Calculate Stress : (F =
mg)
/Pa
Safety
X
: -
Calculate strain :
Z
MUST goggles plot strain , E
wear incase wire snaps graph stress against the
gradient
-
-
a
of is
-
place a cushion under masses
Strain


