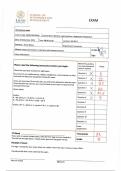
,_',i~:':— " I
(-=8=) | SCHOOL OF
%=” | ECONOMICS AND
LUND
UNIVERSITY !
' MANAGEMENT EXAM
Anonymous code:
Course code: DABN13/STAN51 Course name: Machine Learning from a
Regression Perspective
Date: 07 December 2023 Time: 08:00-13:00
Location: MA 9C-D
Examiner: Simon Reese
Department: Economics
6 =
] )
Allowed means of assistance: Calculator with
cleared memory ID OK: /
\
Other information:
Sign:
Mark the questions
Please read the following instructions before you
begin: you have answered Points
with an X below
Check that you have received the right
exam.
Question 1 >< X
You may not use mobile phones, tablet
s, headphones, smart watches or other
techni cal and electronic equipment during the =
exam. Question 2 >< : ? 2
If you are more than 30 minut
es late, you will not be allowed to take the exam.
Once the exam has started, you may not hand Question 3 x 3. S
in your exam or leave the hall
during the first hour.
Question 4 )( iz_
Write clearly.
y
Question 5 X N2
Grades:
A =85-100 %, B = 75-84 %, C = 65-74 %, Question 6 >( 9
D =55-64 %, E = 50-54 %, U (Fail) < 50 %
Question 7
Grades LTH: 5 = grade A, 4 = grades B & C,
3=gradesD&E Question 8
Question 9
Question 10
Question 11
Home
assignments
I Blank
Total points 8 2,
If you wish to submit a blank exam, only the
front page must be handed in.
Tick the box and sign above. A blank exam B
gives you the grade Fail (U). Grade
Receipt of exam
You sign a receipt for your exam when you
collect it from the exam review or exam office
.
I hereby certify that | have collected this
exam.
Date of receipt
Signature
, LU Exam: 2023-12-07, Time: 08:00-13:00
LUSEM Machine Learning for a Regression Perspective
(DABE13/STANS51)
Examiner: Simon Reese
Allowed aids: Calculator with cleared memory
Correct and well-motivated solutions give as
many points as indicated within paren-
theses at each exercise
-
(/
Question 1
p : La L e
In a large Swedish supermarket chain, the logist _;’.‘-"": A
ics team faces a challenge: how to opti- X v
mize inventory across a vast array of products
ing or understocking They hypothesize that the
to reduce costs and avoid either overstock- Kl reqp
demand for different product categories,
such as dairy, frozen foods, and beverages,
might be interconnected To
test this, they
plan to conduct multiple statistical tests to uncov
er any significant nonzero correlations
between the demands for these product catego
ries The goal is to use these insights
to refine their inventory management, leading
to more efficient operations and better
customer satisfaction
FDR -
1 Which types of errors can we make when we
apply a hypothesis test to test for a
nonzero correlation in the demand of two produ
ct categories? State the names of
these errors and their meaning
(2p)
2 Do we encounter any problem if we test the null
hypothesis of no correlation between
demand for two product categories for a moderately
large (e g 25) amount of
category pairs? Please explain Famfl‘z Y7 (2p)
3 A well-known method for situations in which
we conduct a larger number of hy-
pothesis tests is the Bonferroni correc won What does this method do? Why is
this method appropriate for learning the presence
of interconnections if learning is
based on the outcome of a larger number of hypot
hesis tests? (2p)
4 Assume that the logistics team wants to get
a more detailed picture of the inter-
connections between different products Hence,
correlations between the demand
for different individual products is now studied
In comparison to an investiation of
demand for@;&?@, this requires us to conduc
t several hundred hypothesis
tests Which problem do we have with the Bonfer
roni correction if rejecting the
null hypothesis of no correlation between tfi?(le111an({ for two individual products
leads us W between the demand for these two products?
(2p)
5 Which alternative method would be more appro
priate if we want to learn from a
very large number of hypothesis tests? Why is
the numerical measure controlled
by this alternative method more suitable in this
case? Please explain (2p)
, Question 2
Assume we observe a training dataset T = {(ys,%;)};.; containing combinations of one
output variable and p input variables We want to use this training data to learn the
association between x; and y; @mnsion reductiol) is one possible way of limiting the
complexity of the learned association If principal component regression is chosen as a
m dimension reduction method for supervised learning, the first have to learn
the principal components The mathematical problem that we have to solve to get the
first principal component is given by
2 Zil = V,T)(f
min Z (x,- - vlvl_x,-) (xi — vlexi)T (1)
v1:v1Tv1=1 im1
where X = (x1,X2,...,Xn) Is a 7 X p matrix
1 Describe the mathematical problem (1) in words State the goal of our optimization
problem, mention all pieces of information contained in (1) and refer explicilty to
the objects of this mathematical expression (ie vi,X) (2p)
2 The vector v; that solves the optimization problem (1) has a particular name
What is this name? How can we interpret this vector? (1p)
3 We can use the solution to (1) to calculate an n x 1 vector z; How is this vector
called? What is the mathematical expression that we use to calculate z;? (1p)
4 By convention, the data X is standardized (5p)
a) What does that mean?
b) For which reason do we obtain principal components from standardized input
variables instead of raw, untransformed data?
5 There is an alternative, equivalent expression of the mathematical problem (1)
Please derive it, starting at (1) and motivate explicitly every step that you make
(8p)
6 Describe the interpretation of the alternative, equivalent expression that you de-
rived in the previous part of this question in words (2p)
Set up the mathematical problem for finding the m-th principal component and
-~
explain all differences to (1) (4p)
LB
mih zz (X =' UmVim
T3XT) f CXF g =VmVim
e Y
T Xi) St -
™ Virr Vim =}
|2 T
iy T~ 0 V2 o)- TVaVy X
Z=v ) ( Zim e
(76—l[/' 2TVt e VIV AT)
g R T
AR
g}
S Vil |
NA
2
-
_,z\/ I Vfl—’y\l ’yiT +
(-=8=) | SCHOOL OF
%=” | ECONOMICS AND
LUND
UNIVERSITY !
' MANAGEMENT EXAM
Anonymous code:
Course code: DABN13/STAN51 Course name: Machine Learning from a
Regression Perspective
Date: 07 December 2023 Time: 08:00-13:00
Location: MA 9C-D
Examiner: Simon Reese
Department: Economics
6 =
] )
Allowed means of assistance: Calculator with
cleared memory ID OK: /
\
Other information:
Sign:
Mark the questions
Please read the following instructions before you
begin: you have answered Points
with an X below
Check that you have received the right
exam.
Question 1 >< X
You may not use mobile phones, tablet
s, headphones, smart watches or other
techni cal and electronic equipment during the =
exam. Question 2 >< : ? 2
If you are more than 30 minut
es late, you will not be allowed to take the exam.
Once the exam has started, you may not hand Question 3 x 3. S
in your exam or leave the hall
during the first hour.
Question 4 )( iz_
Write clearly.
y
Question 5 X N2
Grades:
A =85-100 %, B = 75-84 %, C = 65-74 %, Question 6 >( 9
D =55-64 %, E = 50-54 %, U (Fail) < 50 %
Question 7
Grades LTH: 5 = grade A, 4 = grades B & C,
3=gradesD&E Question 8
Question 9
Question 10
Question 11
Home
assignments
I Blank
Total points 8 2,
If you wish to submit a blank exam, only the
front page must be handed in.
Tick the box and sign above. A blank exam B
gives you the grade Fail (U). Grade
Receipt of exam
You sign a receipt for your exam when you
collect it from the exam review or exam office
.
I hereby certify that | have collected this
exam.
Date of receipt
Signature
, LU Exam: 2023-12-07, Time: 08:00-13:00
LUSEM Machine Learning for a Regression Perspective
(DABE13/STANS51)
Examiner: Simon Reese
Allowed aids: Calculator with cleared memory
Correct and well-motivated solutions give as
many points as indicated within paren-
theses at each exercise
-
(/
Question 1
p : La L e
In a large Swedish supermarket chain, the logist _;’.‘-"": A
ics team faces a challenge: how to opti- X v
mize inventory across a vast array of products
ing or understocking They hypothesize that the
to reduce costs and avoid either overstock- Kl reqp
demand for different product categories,
such as dairy, frozen foods, and beverages,
might be interconnected To
test this, they
plan to conduct multiple statistical tests to uncov
er any significant nonzero correlations
between the demands for these product catego
ries The goal is to use these insights
to refine their inventory management, leading
to more efficient operations and better
customer satisfaction
FDR -
1 Which types of errors can we make when we
apply a hypothesis test to test for a
nonzero correlation in the demand of two produ
ct categories? State the names of
these errors and their meaning
(2p)
2 Do we encounter any problem if we test the null
hypothesis of no correlation between
demand for two product categories for a moderately
large (e g 25) amount of
category pairs? Please explain Famfl‘z Y7 (2p)
3 A well-known method for situations in which
we conduct a larger number of hy-
pothesis tests is the Bonferroni correc won What does this method do? Why is
this method appropriate for learning the presence
of interconnections if learning is
based on the outcome of a larger number of hypot
hesis tests? (2p)
4 Assume that the logistics team wants to get
a more detailed picture of the inter-
connections between different products Hence,
correlations between the demand
for different individual products is now studied
In comparison to an investiation of
demand for@;&?@, this requires us to conduc
t several hundred hypothesis
tests Which problem do we have with the Bonfer
roni correction if rejecting the
null hypothesis of no correlation between tfi?(le111an({ for two individual products
leads us W between the demand for these two products?
(2p)
5 Which alternative method would be more appro
priate if we want to learn from a
very large number of hypothesis tests? Why is
the numerical measure controlled
by this alternative method more suitable in this
case? Please explain (2p)
, Question 2
Assume we observe a training dataset T = {(ys,%;)};.; containing combinations of one
output variable and p input variables We want to use this training data to learn the
association between x; and y; @mnsion reductiol) is one possible way of limiting the
complexity of the learned association If principal component regression is chosen as a
m dimension reduction method for supervised learning, the first have to learn
the principal components The mathematical problem that we have to solve to get the
first principal component is given by
2 Zil = V,T)(f
min Z (x,- - vlvl_x,-) (xi — vlexi)T (1)
v1:v1Tv1=1 im1
where X = (x1,X2,...,Xn) Is a 7 X p matrix
1 Describe the mathematical problem (1) in words State the goal of our optimization
problem, mention all pieces of information contained in (1) and refer explicilty to
the objects of this mathematical expression (ie vi,X) (2p)
2 The vector v; that solves the optimization problem (1) has a particular name
What is this name? How can we interpret this vector? (1p)
3 We can use the solution to (1) to calculate an n x 1 vector z; How is this vector
called? What is the mathematical expression that we use to calculate z;? (1p)
4 By convention, the data X is standardized (5p)
a) What does that mean?
b) For which reason do we obtain principal components from standardized input
variables instead of raw, untransformed data?
5 There is an alternative, equivalent expression of the mathematical problem (1)
Please derive it, starting at (1) and motivate explicitly every step that you make
(8p)
6 Describe the interpretation of the alternative, equivalent expression that you de-
rived in the previous part of this question in words (2p)
Set up the mathematical problem for finding the m-th principal component and
-~
explain all differences to (1) (4p)
LB
mih zz (X =' UmVim
T3XT) f CXF g =VmVim
e Y
T Xi) St -
™ Virr Vim =}
|2 T
iy T~ 0 V2 o)- TVaVy X
Z=v ) ( Zim e
(76—l[/' 2TVt e VIV AT)
g R T
AR
g}
S Vil |
NA
2
-
_,z\/ I Vfl—’y\l ’yiT +