

ISYE 6402 Homework 4
Background
For this data analysis, you will analyze the daily and weekly domestic passenger count arriving in Hawaii airports. File DailyDomestic.csv contains
the daily number of passengers between May 2019 and February 2023 File WeeklyDomestic.csv contains the weekly number of passengers for
the same time period. Here we will use different ways of fitting the ARIMA model while dealing with trend and seasonality.
library(lubridate)
library(mgcv)
library(tseries)
library(car)
Instructions on reading the data
To read the data in R , save the file in your working directory (make sure you have changed the directory if different from the R working directory)
and read the data using the R function read.csv()
daily <- read.csv("DailyDomestic.csv", head = TRUE)
daily$date <- as.Date(daily$date)
weekly <- read.csv("WeeklyDomestic.csv", head = TRUE)
weekly$week <- as.Date(weekly$week)
Question 1. Trend and seasonality estimation
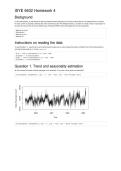
1a. Plot the daily and weekly domestic passenger count separately. Do you see a strong trend and seasonality?
plot(daily$date, daily$domestic, type = "l", xlab = "Time", ylab = "Daily Passenger Count")
plot(weekly$week, weekly$domestic, type = "l", xlab = "Time", ylab = "Weekly Passenger Count")
, Response
From both plots there is a strong seasonality on the time of year. The daily passenger count also shows a strong seasonality on the day of week.
There might be a trend that the number of passenger is increasing through the years but it is not obvious.
1b. (Trend and seasonality) Fit the weekly domestic passenger count with a non-parametric trend using splines and monthly seasonality using
ANOVA. Is the seasonality significant? Plot the fitted values together with the original time series. Plot the residuals and the ACF of the residuals.
Comment on how the model fits and on the appropriateness of the stationarity assumption of the residuals.
time.pts = c(1:length(weekly$week))
month = as.factor(format(weekly$week,"%b"))
model1.weekly = gam(weekly$domestic ~ s(time.pts) + month)
summary(model1.weekly)
##
## Family: gaussian
## Link function: identity
##
## Formula:
## weekly$domestic ~ s(time.pts) + month
##
## Parametric coefficients:
## Estimate Std. Error t value Pr(>|t|)
## (Intercept) 123879 3502 35.375 < 2e-16 ***
## monthAug 22233 4515 4.924 1.88e-06 ***
## monthDec -1947 4581 -0.425 0.67137
## monthFeb 8991 4663 1.928 0.05538 .
## monthJan -7270 4498 -1.616 0.10771
## monthJul 2972 4572 0.650 0.51645
## monthJun 1287 4605 0.280 0.78017
## monthMar 1968 4795 0.411 0.68191
## monthMay 7560 4477 1.689 0.09301 .
## monthNov -12315 4577 -2.691 0.00779 **
## monthOct 13686 4528 3.023 0.00286 **
## monthSep 25287 4582 5.518 1.15e-07 ***
## ---
## Signif. codes: 0 '***' 0.001 '**' 0.01 '*' 0.05 '.' 0.1 ' ' 1
##
## Approximate significance of smooth terms:
## edf Ref.df F p-value
## s(time.pts) 3.899 4.737 6.721 2.16e-05 ***
## ---
## Signif. codes: 0 '***' 0.001 '**' 0.01 '*' 0.05 '.' 0.1 ' ' 1
##
## R-sq.(adj) = 0.468 Deviance explained = 50.8%
## GCV = 1.5551e+08 Scale est. = 1.4315e+08 n = 200
plot(weekly$week, weekly$domestic, col = "black", type = "l", lwd = 2, xlab = "Time", ylab = "Weekly Passenger Count")
lines(weekly$week, fitted(model1.weekly),col = "blue",lwd = 2)
legend('topleft', legend = c("Passenger Count", "Fitted Value"), lwd = 2, col = c("black", "blue"))
Background
For this data analysis, you will analyze the daily and weekly domestic passenger count arriving in Hawaii airports. File DailyDomestic.csv contains
the daily number of passengers between May 2019 and February 2023 File WeeklyDomestic.csv contains the weekly number of passengers for
the same time period. Here we will use different ways of fitting the ARIMA model while dealing with trend and seasonality.
library(lubridate)
library(mgcv)
library(tseries)
library(car)
Instructions on reading the data
To read the data in R , save the file in your working directory (make sure you have changed the directory if different from the R working directory)
and read the data using the R function read.csv()
daily <- read.csv("DailyDomestic.csv", head = TRUE)
daily$date <- as.Date(daily$date)
weekly <- read.csv("WeeklyDomestic.csv", head = TRUE)
weekly$week <- as.Date(weekly$week)
Question 1. Trend and seasonality estimation
1a. Plot the daily and weekly domestic passenger count separately. Do you see a strong trend and seasonality?
plot(daily$date, daily$domestic, type = "l", xlab = "Time", ylab = "Daily Passenger Count")
plot(weekly$week, weekly$domestic, type = "l", xlab = "Time", ylab = "Weekly Passenger Count")
, Response
From both plots there is a strong seasonality on the time of year. The daily passenger count also shows a strong seasonality on the day of week.
There might be a trend that the number of passenger is increasing through the years but it is not obvious.
1b. (Trend and seasonality) Fit the weekly domestic passenger count with a non-parametric trend using splines and monthly seasonality using
ANOVA. Is the seasonality significant? Plot the fitted values together with the original time series. Plot the residuals and the ACF of the residuals.
Comment on how the model fits and on the appropriateness of the stationarity assumption of the residuals.
time.pts = c(1:length(weekly$week))
month = as.factor(format(weekly$week,"%b"))
model1.weekly = gam(weekly$domestic ~ s(time.pts) + month)
summary(model1.weekly)
##
## Family: gaussian
## Link function: identity
##
## Formula:
## weekly$domestic ~ s(time.pts) + month
##
## Parametric coefficients:
## Estimate Std. Error t value Pr(>|t|)
## (Intercept) 123879 3502 35.375 < 2e-16 ***
## monthAug 22233 4515 4.924 1.88e-06 ***
## monthDec -1947 4581 -0.425 0.67137
## monthFeb 8991 4663 1.928 0.05538 .
## monthJan -7270 4498 -1.616 0.10771
## monthJul 2972 4572 0.650 0.51645
## monthJun 1287 4605 0.280 0.78017
## monthMar 1968 4795 0.411 0.68191
## monthMay 7560 4477 1.689 0.09301 .
## monthNov -12315 4577 -2.691 0.00779 **
## monthOct 13686 4528 3.023 0.00286 **
## monthSep 25287 4582 5.518 1.15e-07 ***
## ---
## Signif. codes: 0 '***' 0.001 '**' 0.01 '*' 0.05 '.' 0.1 ' ' 1
##
## Approximate significance of smooth terms:
## edf Ref.df F p-value
## s(time.pts) 3.899 4.737 6.721 2.16e-05 ***
## ---
## Signif. codes: 0 '***' 0.001 '**' 0.01 '*' 0.05 '.' 0.1 ' ' 1
##
## R-sq.(adj) = 0.468 Deviance explained = 50.8%
## GCV = 1.5551e+08 Scale est. = 1.4315e+08 n = 200
plot(weekly$week, weekly$domestic, col = "black", type = "l", lwd = 2, xlab = "Time", ylab = "Weekly Passenger Count")
lines(weekly$week, fitted(model1.weekly),col = "blue",lwd = 2)
legend('topleft', legend = c("Passenger Count", "Fitted Value"), lwd = 2, col = c("black", "blue"))


