

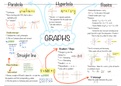
Parabola Hyperbola Basics
2
y = ax + bx + c xy = a / y = a - Relationship between x and y
* Continuous
x - f(x) = y f is the name of the graph
* Has a turning point (TP), that is also a - Ordered number pairs : (x;y)
* Discrete - in 2 separate quadrants
symmetry axis * Notations
* Has asymptotes (line the graph nears
* a = “emotion” - Normal : f : y = 2x + 3 , x R
but never intersects)
- Functional: f(x) = 2x + 3 , x R
* Use table method to
- Choice/Builder: {(x;y) I y = 2x + 3, x R}
draw
* Test for functions:
- Vertical line test: move pen vertically across
Double intercept : graph from left to right. One intersection = Function =
GRAPHS
1. Calculate the x and y intercepts There is only one y value for every x value
2. Plot on Cartesian plane and connect
y-intercept (x=0)
y = 2x + 1 Function Not a function
x-intercept (y=0)
Gradient / Slope * Test for increasing and decreasing:
- Follow graph with pen from left to right
* Change in y over the
Straight line
Pen moves down =
change in x Decreasing
* = Increasing
Pen moves up =
* = Decreasing Increasing
If no method is * Parallel :
How to draw : mentioned, use * Perpendicular : * Restrictions : Values for x and or y that will result in
drawing method you
* Lines with no gradient: an undefined answer.
Y = MX + C
are most comfortable
with Eg.
Table method :
1. Choose a couple of + and - values for x to sub into y = 2x + 1
the equation and find corresponding y values Y-intercept
Where the graph intersects the y-axis
2. Plot the points on Cartesian plane and connect.
2
y = ax + bx + c xy = a / y = a - Relationship between x and y
* Continuous
x - f(x) = y f is the name of the graph
* Has a turning point (TP), that is also a - Ordered number pairs : (x;y)
* Discrete - in 2 separate quadrants
symmetry axis * Notations
* Has asymptotes (line the graph nears
* a = “emotion” - Normal : f : y = 2x + 3 , x R
but never intersects)
- Functional: f(x) = 2x + 3 , x R
* Use table method to
- Choice/Builder: {(x;y) I y = 2x + 3, x R}
draw
* Test for functions:
- Vertical line test: move pen vertically across
Double intercept : graph from left to right. One intersection = Function =
GRAPHS
1. Calculate the x and y intercepts There is only one y value for every x value
2. Plot on Cartesian plane and connect
y-intercept (x=0)
y = 2x + 1 Function Not a function
x-intercept (y=0)
Gradient / Slope * Test for increasing and decreasing:
- Follow graph with pen from left to right
* Change in y over the
Straight line
Pen moves down =
change in x Decreasing
* = Increasing
Pen moves up =
* = Decreasing Increasing
If no method is * Parallel :
How to draw : mentioned, use * Perpendicular : * Restrictions : Values for x and or y that will result in
drawing method you
* Lines with no gradient: an undefined answer.
Y = MX + C
are most comfortable
with Eg.
Table method :
1. Choose a couple of + and - values for x to sub into y = 2x + 1
the equation and find corresponding y values Y-intercept
Where the graph intersects the y-axis
2. Plot the points on Cartesian plane and connect.


