

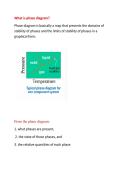
What is phase diagram?
Phase diagram is basically a map that presents the domains of
stability of phases and the limits of stability of phases in a
graphical form.
From the phase diagram:
1. what phases are present,
2. the state of those phases, and
3. the relative quantities of each phase
,What is phase?
❑ A phase is a homogenous, physically distinct and
mechanically separable portion of the material with a given
chemical composition and structure.
Iron, being an allotropic material, has more than one solid
phases:
❑ When iron freezes at 1538 C from its liquid state, the first
solid formed has BCC structure (which is known as d-iron)
❑ As it cools down to 1401 C, it changes to FCC structure
(which is known as g-iron)
❑ Upon further cooling down to 910 C, it changes again to BCC
structure (which is known as a-iron)
Melting point:
Iron 1538 c
Ni 1455 c
Cu 1085 C
Zn 419 c
,iron loses its magnetic properties at its Curie point, which is
approximately 770°C (1418°F). paramagnetic
Ferromagnetic = Strong, permanent magnetism (e.g., iron below 770 °C)
Paramagnetic = Weak, temporary magnetism (e.g., iron above 770 °C)
Diamagnetic = Very weak repulsion from magnetic fields
Microstructure:
, Si Content (wt%) Phase Type Use Case
< 12.6 Hypoeutectic Good ductility, moderate wear
12.6 Eutectic Balance of castability & wear
> 12.6 Hypereutectic High wear resistance
14–25 Common for wear apps Pistons, engine blocks, etc.
Pearlite (fingerprint-like texture): . 0.8% Carbon
Graphite (grey patches): 100% carbon
Phase diagram is basically a map that presents the domains of
stability of phases and the limits of stability of phases in a
graphical form.
From the phase diagram:
1. what phases are present,
2. the state of those phases, and
3. the relative quantities of each phase
,What is phase?
❑ A phase is a homogenous, physically distinct and
mechanically separable portion of the material with a given
chemical composition and structure.
Iron, being an allotropic material, has more than one solid
phases:
❑ When iron freezes at 1538 C from its liquid state, the first
solid formed has BCC structure (which is known as d-iron)
❑ As it cools down to 1401 C, it changes to FCC structure
(which is known as g-iron)
❑ Upon further cooling down to 910 C, it changes again to BCC
structure (which is known as a-iron)
Melting point:
Iron 1538 c
Ni 1455 c
Cu 1085 C
Zn 419 c
,iron loses its magnetic properties at its Curie point, which is
approximately 770°C (1418°F). paramagnetic
Ferromagnetic = Strong, permanent magnetism (e.g., iron below 770 °C)
Paramagnetic = Weak, temporary magnetism (e.g., iron above 770 °C)
Diamagnetic = Very weak repulsion from magnetic fields
Microstructure:
, Si Content (wt%) Phase Type Use Case
< 12.6 Hypoeutectic Good ductility, moderate wear
12.6 Eutectic Balance of castability & wear
> 12.6 Hypereutectic High wear resistance
14–25 Common for wear apps Pistons, engine blocks, etc.
Pearlite (fingerprint-like texture): . 0.8% Carbon
Graphite (grey patches): 100% carbon


