

Unit 6
Part C and D
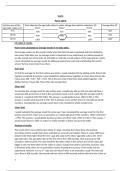
Surface area of the Time taken for the agar jelly cubes to colour change form pink to colourless. (S) Average time (S)
agar jelly cubes (cm2) Trial 1 Trial 2 Trial 3
5×5 500 510 505 505
10×10 938 900 925 932
15×15 1303 1312 1307 1307
My table of results.
How I have calculated my average results in my data table.
My average results are the overall results when the data has been calculated and then divided by
how many trials there are. An average result is important in any experiment as it allows people to
see the overall view of the data set and helps us with the overall analysis of the experiments results.
I have calculated my average results by adding up values from each trial and dividing the overall
answer by how many trials I have done.
5cm3 trial.
To find the average for the first surface area trials, I would calculate this by adding up the three trials
together and divide it by three. I gave divided the added answer together as I have done three trials.
I have done 500 + 510 + 505 = 1515. This is the sum of all of the three trials added together. I the
divided 515 by 3 to get 505. This is then the average time.
10cm3 trial
To calculate the average result for this surface area, I would only add up trial one and trial three. I
would not add up trial two as that is the anomalous result, and it could alter the average result if I
include it. I would do 938+925=1863. This answer, I would divide by two. 1863÷2=931.5. This
answer, I would round upwards to 932. This is because every number that is in my table are whole
numbers, meaning that my average results have to be rounded to whole numbers too.
15cm3 trial.
I would calculate this average result the same way I have calculated the average result for the first
surface area (5cm3). There are no anomalies, so I would add up all of the numbers. 1303+1312+1307
= 3992. This answer, I would divide by three as there are three trials. 3992÷3=1307.3. This answer, I
would round down to 1307, to make it a whole number so that it can go in the table.
Analysis of results.
The results that I have collected are similar in range, meaning that I have done the practical
accurately and the results that I have collected are accurate and reliable. There is a clear difference
between the times taken from the 5cm 2 agar jelly cube to the 10cm2 agar jelly cube to the 15cm2
agar jelly cube. The agar jelly cube for the first trial is from 500 seconds, then it goes up to 938
seconds to 1303 seconds. The clear trend for the table is that as the surface area of the cubes get
bigger in size, the time taken for the cubes to colour change from pink to colourless increases. Also,
in the three trials, there are no anomalous results, showing the accuracy of my results and my
experiment. However, for my 2nd cube size (10×10cm2) there is an anomalous result. The first trial
has a time of 938 seconds, the second trial has a time of 900 seconds and the third trial has a time of
1
, 925 seconds. The second trial has the anomalous results. This could be as a result of human error.
For example, I could have cut the size of the cube a little bit smaller due to an error in measuring out
and cutting the cubes, or there could be a possibility that the colour just diffused out of the cube
faster. My experiment can be seen as accurate as the results show accuracy. For example, looking at
the experiment, you can see that as the cube sizes get bigger, the time taken for diffusion to happen
also increases. This is what should happen, showing how accurate my experiment and my results
are. My experiment is accurate to follow as it produces accurate results, meaning that people can
follow it and expect to get the same sort of results, or the same trend of results. My experiment is
reliable to follow and my results are reliable to use. This is because it matches the hypothesis of this
experiment and the results match the trend of results of other people’s experiment. Also, because I
have done three trials, the accuracy of the results and method can be shown. My experiment and
results that I have collected are precise and have been followed out with precision. I have done my
experiment with precision as I have researched to make sure that I have everything precise when
doing this experiment. For example, I have used specific equipment in order to make sure that my
measurements are really accurate. This makes my experimental accuracy more precise and more
authentic. I have made sure that I have used my measuring skills and my experimental skills to make
the practical more precise and accurate, making sure that my results would come out really precise
and authentic. My method is able to be repeated by other people, as it is clear and simple for people
to follow. My results can be obtained when the method is repeated and they are accurate due to the
trend and comparison with other results. My results only have one source of error, which is the
anomaly in the second trial of the second cube size (10cm 2). This isn’t really an error, but it can be
seen as one as this particular result doesn't fit the overall trend of the results. An anomaly is usually
present in any experiment, so the magnitude of the error isn’t bad. Also, the anomaly that I have
isn’t a bad anomaly as it is still in the same range of the other results. For example, my results are
938 seconds and 925 seconds. My anomalous result is 900 seconds. This anomalous result isn't far
off the other results, making the magnitude of the anomaly small. I have no other source of error in
my results.
Statistical tests.
Statistical tests are tests that can help further analyse the data that is given to you, or the data that
you have collected. These tests are important as they show how accurate and valid your data is or
isn't and it shows how authentic the data is that you have collected, or that has been given to you.
These statistical tests can also give you an insight into how your data that you have collected is
accurate or not. Statistical tests can help you further see how to improve your experiment with the
result that you have collected or have been given to you.
Standard deviation.
Standard deviation.
5
9
5
The standard deviation is a statistical test to see how consistent the data that I have collected is. This
statistical test also shows how valid that data that you have collected is. If the standard deviation for
the data set is a high number, then the data can be seen as not valid or accurate. The lower the
standard deviation is, the more accurate and valid the data set. This is the standard deviation results
for each of my surface areas lf agar jelly that I have tested. I have gotten low results for my standard
deviation, meaning that my results are accurate. I have also used excel to work out my standard
deviation. This is so that my results do not come out wrong and that the results are accurately
2
Part C and D
Surface area of the Time taken for the agar jelly cubes to colour change form pink to colourless. (S) Average time (S)
agar jelly cubes (cm2) Trial 1 Trial 2 Trial 3
5×5 500 510 505 505
10×10 938 900 925 932
15×15 1303 1312 1307 1307
My table of results.
How I have calculated my average results in my data table.
My average results are the overall results when the data has been calculated and then divided by
how many trials there are. An average result is important in any experiment as it allows people to
see the overall view of the data set and helps us with the overall analysis of the experiments results.
I have calculated my average results by adding up values from each trial and dividing the overall
answer by how many trials I have done.
5cm3 trial.
To find the average for the first surface area trials, I would calculate this by adding up the three trials
together and divide it by three. I gave divided the added answer together as I have done three trials.
I have done 500 + 510 + 505 = 1515. This is the sum of all of the three trials added together. I the
divided 515 by 3 to get 505. This is then the average time.
10cm3 trial
To calculate the average result for this surface area, I would only add up trial one and trial three. I
would not add up trial two as that is the anomalous result, and it could alter the average result if I
include it. I would do 938+925=1863. This answer, I would divide by two. 1863÷2=931.5. This
answer, I would round upwards to 932. This is because every number that is in my table are whole
numbers, meaning that my average results have to be rounded to whole numbers too.
15cm3 trial.
I would calculate this average result the same way I have calculated the average result for the first
surface area (5cm3). There are no anomalies, so I would add up all of the numbers. 1303+1312+1307
= 3992. This answer, I would divide by three as there are three trials. 3992÷3=1307.3. This answer, I
would round down to 1307, to make it a whole number so that it can go in the table.
Analysis of results.
The results that I have collected are similar in range, meaning that I have done the practical
accurately and the results that I have collected are accurate and reliable. There is a clear difference
between the times taken from the 5cm 2 agar jelly cube to the 10cm2 agar jelly cube to the 15cm2
agar jelly cube. The agar jelly cube for the first trial is from 500 seconds, then it goes up to 938
seconds to 1303 seconds. The clear trend for the table is that as the surface area of the cubes get
bigger in size, the time taken for the cubes to colour change from pink to colourless increases. Also,
in the three trials, there are no anomalous results, showing the accuracy of my results and my
experiment. However, for my 2nd cube size (10×10cm2) there is an anomalous result. The first trial
has a time of 938 seconds, the second trial has a time of 900 seconds and the third trial has a time of
1
, 925 seconds. The second trial has the anomalous results. This could be as a result of human error.
For example, I could have cut the size of the cube a little bit smaller due to an error in measuring out
and cutting the cubes, or there could be a possibility that the colour just diffused out of the cube
faster. My experiment can be seen as accurate as the results show accuracy. For example, looking at
the experiment, you can see that as the cube sizes get bigger, the time taken for diffusion to happen
also increases. This is what should happen, showing how accurate my experiment and my results
are. My experiment is accurate to follow as it produces accurate results, meaning that people can
follow it and expect to get the same sort of results, or the same trend of results. My experiment is
reliable to follow and my results are reliable to use. This is because it matches the hypothesis of this
experiment and the results match the trend of results of other people’s experiment. Also, because I
have done three trials, the accuracy of the results and method can be shown. My experiment and
results that I have collected are precise and have been followed out with precision. I have done my
experiment with precision as I have researched to make sure that I have everything precise when
doing this experiment. For example, I have used specific equipment in order to make sure that my
measurements are really accurate. This makes my experimental accuracy more precise and more
authentic. I have made sure that I have used my measuring skills and my experimental skills to make
the practical more precise and accurate, making sure that my results would come out really precise
and authentic. My method is able to be repeated by other people, as it is clear and simple for people
to follow. My results can be obtained when the method is repeated and they are accurate due to the
trend and comparison with other results. My results only have one source of error, which is the
anomaly in the second trial of the second cube size (10cm 2). This isn’t really an error, but it can be
seen as one as this particular result doesn't fit the overall trend of the results. An anomaly is usually
present in any experiment, so the magnitude of the error isn’t bad. Also, the anomaly that I have
isn’t a bad anomaly as it is still in the same range of the other results. For example, my results are
938 seconds and 925 seconds. My anomalous result is 900 seconds. This anomalous result isn't far
off the other results, making the magnitude of the anomaly small. I have no other source of error in
my results.
Statistical tests.
Statistical tests are tests that can help further analyse the data that is given to you, or the data that
you have collected. These tests are important as they show how accurate and valid your data is or
isn't and it shows how authentic the data is that you have collected, or that has been given to you.
These statistical tests can also give you an insight into how your data that you have collected is
accurate or not. Statistical tests can help you further see how to improve your experiment with the
result that you have collected or have been given to you.
Standard deviation.
Standard deviation.
5
9
5
The standard deviation is a statistical test to see how consistent the data that I have collected is. This
statistical test also shows how valid that data that you have collected is. If the standard deviation for
the data set is a high number, then the data can be seen as not valid or accurate. The lower the
standard deviation is, the more accurate and valid the data set. This is the standard deviation results
for each of my surface areas lf agar jelly that I have tested. I have gotten low results for my standard
deviation, meaning that my results are accurate. I have also used excel to work out my standard
deviation. This is so that my results do not come out wrong and that the results are accurately
2


