Capstone® Industry Conditions Report For C151787_047
Your instructor can customize the simulation scenario. The information below is specific to your industry.
Printable and Downloadable PDF Version of This Report
The sensors your company manufactures are incorporated into the products your customers sell.
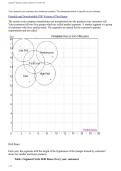
Your customers fall into five groups which are called market segments. A market segment is a group
of customers who have similar needs. The segments are named for the customer's primary
requirements and are called:
Drift Rates
Each year, the segments drift the length of the hypotenuse of the triangle formed by customers'
desire for smaller and faster products.
Table 1 Segment Circle Drift Rates: Every year, customers
demand increased performance (Pfmn) and decreased size.
1 of 8
,Capstone® Industry Conditions Report For C151787_047
demand increased performance (Pfmn) and decreased size.
Note that the drift rates vary for each segment.
Pfmn Size
Traditional +0.7 -0.7
Low End +0.5 -0.5
High End +0.9 -0.9
Performance +1.0 -0.7
Size +0.7 -1.0
Segment Centers
Table 2 Segment Centers at the End of Each Round: As shown in the Perceptual
Map Form above, size is on the vertical axis and performance (Pfmn) is on the
horizontal axis.
Traditional Low End High End Performance Size
Round Pfmn Size Pfmn Size Pfmn Size Pfmn Size Pfmn Size
0 5.0 15.0 2.5 17.5 7.5 12.5 8.0 17.0 3.0 12.0
1 5.7 14.3 3.0 17.0 8.4 11.6 9.0 16.3 3.7 11.0
2 6.4 13.6 3.5 16.5 9.3 10.7 10.0 15.6 4.4 10.0
3 7.1 12.9 4.0 16.0 10.2 9.8 11.0 14.9 5.1 9.0
4 7.8 12.2 4.5 15.5 11.1 8.9 12.0 14.2 5.8 8.0
5 8.5 11.5 5.0 15.0 12.0 8.0 13.0 13.5 6.5 7.0
6 9.2 10.8 5.5 14.5 12.9 7.1 14.0 12.8 7.2 6.0
7 9.9 10.1 6.0 14.0 13.8 6.2 15.0 12.1 7.9 5.0
8 10.6 9.4 6.5 13.5 14.7 5.3 16.0 11.4 8.6 4.0
The information in Table 2 reflects the segment centers at the end of the round. Therefore, the
Round 0 positions can be seen as the Round 1 starting positions, Round 2 positions can be seen as
the Round 3 starting position, etc. Each month during the simulation year, the segment drifts 1/12th
of the distance from the starting position to the ending position.
Ideal Spots
Table 3 Ideal Spot Offsets:
Customers prefer products
located this distance from
2 of 8
, Capstone® Industry Conditions Report For C151787_047
the center of the segment circle.
Pfmn Size
Traditional 0.0 0.0
Low End -0.8 +0.8
High End +1.4 -1.4
Performance +1.4 -1.0
Size +1.0 -1.4
The information in Table 3 shows the Ideal Spot "offsets" or distances from the segment center. The
ideal spot is that point where, all other things being equal, demand is highest. It is different from the
segment center. Why are some ideal spots ahead of the segment centers? The segments are moving.
From a customer’s perspective, if they buy a product at the ideal spot, it will still be a cutting edge
product when it wears out.
2 Segment Sizes and Growth Rates
At the beginning of the simulation, Traditional and Low End sell more units than the high
technology segments, High End, Performance and Size. Page 10 of the Capstone Courier, the
Market Segment Report, displays total industry sales.
Each market segment grows at a different rate. Table 4 lists the beginning segment growth rates for
your industry. The growth rates might change from year to year. Check the Segment Analysis
reports in the Capstone Courier each round for the upcoming year's growth rates.
Table 4 Beginning Segment Growth Rates
Traditional 9.2%
Low End 11.7%
High End 16.2%
Performance 19.8%
Size 18.3%
3 Buying Criteria By Segment
These are your products and the primary segments they sell into at the beginning of the simulation.
These can change according to your decisions and as the simulation evolves.
Able Traditional
Acre Low End
Adam High End
Aft Performance
Agape Size
3 of 8
Your instructor can customize the simulation scenario. The information below is specific to your industry.
Printable and Downloadable PDF Version of This Report
The sensors your company manufactures are incorporated into the products your customers sell.
Your customers fall into five groups which are called market segments. A market segment is a group
of customers who have similar needs. The segments are named for the customer's primary
requirements and are called:
Drift Rates
Each year, the segments drift the length of the hypotenuse of the triangle formed by customers'
desire for smaller and faster products.
Table 1 Segment Circle Drift Rates: Every year, customers
demand increased performance (Pfmn) and decreased size.
1 of 8
,Capstone® Industry Conditions Report For C151787_047
demand increased performance (Pfmn) and decreased size.
Note that the drift rates vary for each segment.
Pfmn Size
Traditional +0.7 -0.7
Low End +0.5 -0.5
High End +0.9 -0.9
Performance +1.0 -0.7
Size +0.7 -1.0
Segment Centers
Table 2 Segment Centers at the End of Each Round: As shown in the Perceptual
Map Form above, size is on the vertical axis and performance (Pfmn) is on the
horizontal axis.
Traditional Low End High End Performance Size
Round Pfmn Size Pfmn Size Pfmn Size Pfmn Size Pfmn Size
0 5.0 15.0 2.5 17.5 7.5 12.5 8.0 17.0 3.0 12.0
1 5.7 14.3 3.0 17.0 8.4 11.6 9.0 16.3 3.7 11.0
2 6.4 13.6 3.5 16.5 9.3 10.7 10.0 15.6 4.4 10.0
3 7.1 12.9 4.0 16.0 10.2 9.8 11.0 14.9 5.1 9.0
4 7.8 12.2 4.5 15.5 11.1 8.9 12.0 14.2 5.8 8.0
5 8.5 11.5 5.0 15.0 12.0 8.0 13.0 13.5 6.5 7.0
6 9.2 10.8 5.5 14.5 12.9 7.1 14.0 12.8 7.2 6.0
7 9.9 10.1 6.0 14.0 13.8 6.2 15.0 12.1 7.9 5.0
8 10.6 9.4 6.5 13.5 14.7 5.3 16.0 11.4 8.6 4.0
The information in Table 2 reflects the segment centers at the end of the round. Therefore, the
Round 0 positions can be seen as the Round 1 starting positions, Round 2 positions can be seen as
the Round 3 starting position, etc. Each month during the simulation year, the segment drifts 1/12th
of the distance from the starting position to the ending position.
Ideal Spots
Table 3 Ideal Spot Offsets:
Customers prefer products
located this distance from
2 of 8
, Capstone® Industry Conditions Report For C151787_047
the center of the segment circle.
Pfmn Size
Traditional 0.0 0.0
Low End -0.8 +0.8
High End +1.4 -1.4
Performance +1.4 -1.0
Size +1.0 -1.4
The information in Table 3 shows the Ideal Spot "offsets" or distances from the segment center. The
ideal spot is that point where, all other things being equal, demand is highest. It is different from the
segment center. Why are some ideal spots ahead of the segment centers? The segments are moving.
From a customer’s perspective, if they buy a product at the ideal spot, it will still be a cutting edge
product when it wears out.
2 Segment Sizes and Growth Rates
At the beginning of the simulation, Traditional and Low End sell more units than the high
technology segments, High End, Performance and Size. Page 10 of the Capstone Courier, the
Market Segment Report, displays total industry sales.
Each market segment grows at a different rate. Table 4 lists the beginning segment growth rates for
your industry. The growth rates might change from year to year. Check the Segment Analysis
reports in the Capstone Courier each round for the upcoming year's growth rates.
Table 4 Beginning Segment Growth Rates
Traditional 9.2%
Low End 11.7%
High End 16.2%
Performance 19.8%
Size 18.3%
3 Buying Criteria By Segment
These are your products and the primary segments they sell into at the beginning of the simulation.
These can change according to your decisions and as the simulation evolves.
Able Traditional
Acre Low End
Adam High End
Aft Performance
Agape Size
3 of 8