
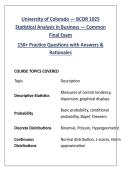
University of Colorado — BCOR 1025
Statistical Analysis in Business — Common
Final Exam
150+ Practice Questions with Answers &
Rationales
COURSE TOPICS COVERED
Topic Description
Measures of central tendency,
Descriptive Statistics
dispersion, graphical displays
Basic probability, conditional
Probability
probability, Bayes' theorem
Discrete Distributions Binomial, Poisson, Hypergeometric
Continuous Normal distribution, z-scores, Norma
Distributions approximation
,Topic Description
Sampling & Sampling
Central Limit Theorem, standard erro
Distributions
Confidence Intervals For means, proportions, and varianc
One-sample, two-sample tests; t-tes
Hypothesis Testing
z-tests, chi-square
Correlation Correlation coefficient, interpretatio
Simple Linear Least squares, interpretation,
Regression inference
Multiple predictors, interpretation,
Multiple Regression
model building
ANOVA Analysis of variance
Chi-Square Tests Goodness-of-fit, independence
Excel Applications Using Excel for statistical analysis
,PART I: DESCRIPTIVE STATISTICS & DATA
VISUALIZATION (Questions 1-25)
1. Which of the following is a measure of central
tendency?
• A) Standard deviation
• B) Variance
• C) Median
• D) Range
• E) Interquartile range
Answer: C
Rationale: Measures of central tendency describe the
center of a dataset. The median, mean, and mode are
measures of central tendency. Standard deviation,
variance, range, and IQR are measures of dispersion.
2. The mean of a dataset is:
, • A) The middle value when data are ordered
• B) The most frequently occurring value
• C) The sum of all values divided by the number of
values
• D) The difference between the maximum and
minimum
• E) The square root of the variance
Answer: C
Rationale: The mean is calculated as the sum of all
observations divided by the number of observations.
3. The median of a dataset is:
• A) The average of all values
• B) The middle value when data are ordered
• C) The most frequently occurring value
• D) The difference between the maximum and
minimum
Statistical Analysis in Business — Common
Final Exam
150+ Practice Questions with Answers &
Rationales
COURSE TOPICS COVERED
Topic Description
Measures of central tendency,
Descriptive Statistics
dispersion, graphical displays
Basic probability, conditional
Probability
probability, Bayes' theorem
Discrete Distributions Binomial, Poisson, Hypergeometric
Continuous Normal distribution, z-scores, Norma
Distributions approximation
,Topic Description
Sampling & Sampling
Central Limit Theorem, standard erro
Distributions
Confidence Intervals For means, proportions, and varianc
One-sample, two-sample tests; t-tes
Hypothesis Testing
z-tests, chi-square
Correlation Correlation coefficient, interpretatio
Simple Linear Least squares, interpretation,
Regression inference
Multiple predictors, interpretation,
Multiple Regression
model building
ANOVA Analysis of variance
Chi-Square Tests Goodness-of-fit, independence
Excel Applications Using Excel for statistical analysis
,PART I: DESCRIPTIVE STATISTICS & DATA
VISUALIZATION (Questions 1-25)
1. Which of the following is a measure of central
tendency?
• A) Standard deviation
• B) Variance
• C) Median
• D) Range
• E) Interquartile range
Answer: C
Rationale: Measures of central tendency describe the
center of a dataset. The median, mean, and mode are
measures of central tendency. Standard deviation,
variance, range, and IQR are measures of dispersion.
2. The mean of a dataset is:
, • A) The middle value when data are ordered
• B) The most frequently occurring value
• C) The sum of all values divided by the number of
values
• D) The difference between the maximum and
minimum
• E) The square root of the variance
Answer: C
Rationale: The mean is calculated as the sum of all
observations divided by the number of observations.
3. The median of a dataset is:
• A) The average of all values
• B) The middle value when data are ordered
• C) The most frequently occurring value
• D) The difference between the maximum and
minimum


