SNAB Topic 5 THE NOTES
5.1 Understand the terms ecosystem, community, population and habitat.
5.2 Understand that the numbers and distribution of organisms in a habitat are controlled by biotic and abiotic factors.
5.3 Understand how the concept of niche accounts for distribution and abundance of organisms in a habitat.
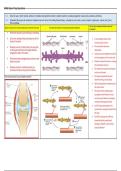
5.4 Understand the stages of succession from colonisation to a climax community.
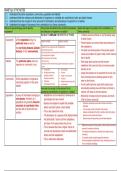
What is the key terminology used to describe How do biotic and abiotic factors control the abundance Explain the stages of succession from colonisation to a
ecosystems? and distribution of organisms in a habitat? climax community.
BE ABLE TO EXPLAIN THE EFFECTS OF THESE: ○ A lifeless area has extremes or very fluctuating range
ecosystem all the organisms living in a of abiotic factors
BIOTIC FACTORS ABIOTIC FACTORS
particular area as well as ○ Pioneer species can colonise these areas because of
Organisms have a particular set of adaptations. their adaptations
the non-living features (abiotic
And a particular niche. ○ The death and decomposition of the pioneer species
factors) of their environment. If the abiotic/biotic factors suit their niche their chance of survival
and reproduction is higher causes accumulation of organic matter, which improves
Their abundance will increase. the soil quality
habitat The particular place where an And vice versa. ○ Other larger plant species can then become
organism or community, lives. Distribution refers to where the organisms abundance is higher or
lower. established, their roots bind the soil, improving water
• Competition • Solar energy retention of soil
• Feeding relationships • Climate ○ Larger plant species can be supported by the soil, and
(grazing, predation, • Oxygen concentration
disease, parasitism)
then outcompete the pre-existing species for light,
community All the populations of organisms • Pollution
• Mutualism • Edaphic factors (eg soil pH) water or other factors
interacting together in the same
• Anthropogenic factors • catastrophes ○ As soil quality improves, larger plant species grow,
habitat
How does the concept of niche account for the outcompeting existing ones until climax community is
abundance and distribution of organisms in a habitat? reached, with trees as dominant species.
population A group of individuals belonging to ○ Adaptations can be anatomical, behavioural or ○ Biodiversity increases during the process, and levels
one species. Members of a physiological and are evolved. off at the climax community.
population are generally found in ○ Species are adapted to exploit that available ○ Secondary succession occurs after a climax community is
one place at a particular time destroyed.
abiotic and biotic factors in their habitat
and are able to breed with one ○ The soil quality is high at the start of the process
another. ○ This is also called their niche. ○ Grasses and plants are the first to colonise, rather than pioneer
○ The abundance of a species will be highest where species such as mosses and lichens.
○ Because they are fast growing, use wind seed dispersal
the abiotic/biotic factors suit their adaptations,
and lower in the areas where they do not.
○ Deflected succession is when grazing or other activity prevents the
○ This is because they have a higher chance of process of succession continuing
survival and reproduction where the abiotic/biotic ○ The habitat is maintained in a state that never reaches climax
factors suit their adaptations community
○ For example, plants constantly grazed by herbivores
○ This is called their distribution ○ So that competition for light doesn’t occur, and taller plants do not
have a competitive advantage.
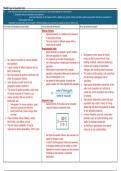
, CORE PRACTICAL 10:
Carry out a study on the ecology of a habitat, such as using quadrats and transects to determine distribution and abundance of organisms, and
measuring abiotic factors appropriate to the habitat.
When and how do we use random sampling? When and how do we use systematic sampling? How is the data from ecological studies analysed?
RANDOM SAMPLING
• Comparing one area vs another area
• For example using one area as a control, and
another area which has been treated
differently
• To determine the species richness or
biodiversity index of an area
• Analysis can include:
o Calculating the biodiversity index
o Calculating mean and SD and
comparing between the two areas
o Using a t-test to determine statistical
significance of any differences
○ Compare two areas with different abiotic ○ To see if there’s a correlation between abiotic SYSTEMATIC SAMPLING (TRANSECT)
conditions factor and biodiversity • Determining the effect of an abiotic factor on
○ Use random number generation to place ○ Place transect along direction which the abiotic abundance and distribution
quadrats using random sampling factors may change • For example succession
○ This prevents bias. ○ Systematically place quadrat at regular intervals • Data can be analysed by plotting a graph of
○ For each quadrat: along transect species abundance vs distance
■ Identify the number of different species present ○ Use quadrats to • Also using a stistical test like Spearman Rank
(richness) ■ Identify the (number of) different species present correlation coefficient to test for significant
(richness) correlation.
■ Count the numbers of individuals of each
species (abundance) ■ Count the individuals of each species
○ Also measure the abiotic factor for each quadrat ○ Also measure the abiotic factor for each quadrat
(light, pH, temperature etc.) (light, pH, temperature etc.)
○ Repeat process in the second area ○ Ensure sampling takes place at the same time,
○ Ensure sampling takes place at the same time, using the same method to be valid
using the same method to be valid ○ Use statistical test to determine correlation
○ Use a t-test/mean and SD to compare two areas (Spearman rank test)
○ BE READY TO ADAPT THIS METHOD TO A
RANGE OF SCENARIOS
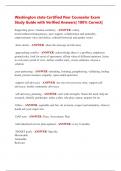
5.1 Understand the terms ecosystem, community, population and habitat.
5.2 Understand that the numbers and distribution of organisms in a habitat are controlled by biotic and abiotic factors.
5.3 Understand how the concept of niche accounts for distribution and abundance of organisms in a habitat.
5.4 Understand the stages of succession from colonisation to a climax community.
What is the key terminology used to describe How do biotic and abiotic factors control the abundance Explain the stages of succession from colonisation to a
ecosystems? and distribution of organisms in a habitat? climax community.
BE ABLE TO EXPLAIN THE EFFECTS OF THESE: ○ A lifeless area has extremes or very fluctuating range
ecosystem all the organisms living in a of abiotic factors
BIOTIC FACTORS ABIOTIC FACTORS
particular area as well as ○ Pioneer species can colonise these areas because of
Organisms have a particular set of adaptations. their adaptations
the non-living features (abiotic
And a particular niche. ○ The death and decomposition of the pioneer species
factors) of their environment. If the abiotic/biotic factors suit their niche their chance of survival
and reproduction is higher causes accumulation of organic matter, which improves
Their abundance will increase. the soil quality
habitat The particular place where an And vice versa. ○ Other larger plant species can then become
organism or community, lives. Distribution refers to where the organisms abundance is higher or
lower. established, their roots bind the soil, improving water
• Competition • Solar energy retention of soil
• Feeding relationships • Climate ○ Larger plant species can be supported by the soil, and
(grazing, predation, • Oxygen concentration
disease, parasitism)
then outcompete the pre-existing species for light,
community All the populations of organisms • Pollution
• Mutualism • Edaphic factors (eg soil pH) water or other factors
interacting together in the same
• Anthropogenic factors • catastrophes ○ As soil quality improves, larger plant species grow,
habitat
How does the concept of niche account for the outcompeting existing ones until climax community is
abundance and distribution of organisms in a habitat? reached, with trees as dominant species.
population A group of individuals belonging to ○ Adaptations can be anatomical, behavioural or ○ Biodiversity increases during the process, and levels
one species. Members of a physiological and are evolved. off at the climax community.
population are generally found in ○ Species are adapted to exploit that available ○ Secondary succession occurs after a climax community is
one place at a particular time destroyed.
abiotic and biotic factors in their habitat
and are able to breed with one ○ The soil quality is high at the start of the process
another. ○ This is also called their niche. ○ Grasses and plants are the first to colonise, rather than pioneer
○ The abundance of a species will be highest where species such as mosses and lichens.
○ Because they are fast growing, use wind seed dispersal
the abiotic/biotic factors suit their adaptations,
and lower in the areas where they do not.
○ Deflected succession is when grazing or other activity prevents the
○ This is because they have a higher chance of process of succession continuing
survival and reproduction where the abiotic/biotic ○ The habitat is maintained in a state that never reaches climax
factors suit their adaptations community
○ For example, plants constantly grazed by herbivores
○ This is called their distribution ○ So that competition for light doesn’t occur, and taller plants do not
have a competitive advantage.
, CORE PRACTICAL 10:
Carry out a study on the ecology of a habitat, such as using quadrats and transects to determine distribution and abundance of organisms, and
measuring abiotic factors appropriate to the habitat.
When and how do we use random sampling? When and how do we use systematic sampling? How is the data from ecological studies analysed?
RANDOM SAMPLING
• Comparing one area vs another area
• For example using one area as a control, and
another area which has been treated
differently
• To determine the species richness or
biodiversity index of an area
• Analysis can include:
o Calculating the biodiversity index
o Calculating mean and SD and
comparing between the two areas
o Using a t-test to determine statistical
significance of any differences
○ Compare two areas with different abiotic ○ To see if there’s a correlation between abiotic SYSTEMATIC SAMPLING (TRANSECT)
conditions factor and biodiversity • Determining the effect of an abiotic factor on
○ Use random number generation to place ○ Place transect along direction which the abiotic abundance and distribution
quadrats using random sampling factors may change • For example succession
○ This prevents bias. ○ Systematically place quadrat at regular intervals • Data can be analysed by plotting a graph of
○ For each quadrat: along transect species abundance vs distance
■ Identify the number of different species present ○ Use quadrats to • Also using a stistical test like Spearman Rank
(richness) ■ Identify the (number of) different species present correlation coefficient to test for significant
(richness) correlation.
■ Count the numbers of individuals of each
species (abundance) ■ Count the individuals of each species
○ Also measure the abiotic factor for each quadrat ○ Also measure the abiotic factor for each quadrat
(light, pH, temperature etc.) (light, pH, temperature etc.)
○ Repeat process in the second area ○ Ensure sampling takes place at the same time,
○ Ensure sampling takes place at the same time, using the same method to be valid
using the same method to be valid ○ Use statistical test to determine correlation
○ Use a t-test/mean and SD to compare two areas (Spearman rank test)
○ BE READY TO ADAPT THIS METHOD TO A
RANGE OF SCENARIOS