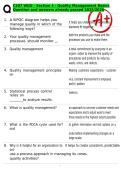
C207 WGU - Section 4 - Quality Management Basics
Question and answers already passed 2025/2026
1. A SIPOC diagram helps you
It helps you understand how process
manage quality in which of the
elements fit together.
following ways?
2. Your quality management both the products you make and the
processes should monitor . processes you use to make them
3. Quality management A total commitment by everyone in an
organi- zation to improve the quality of
procedures and products by reducing
waste, errors, and defects.
4. Quality management principles Meeting customers expectations - customer
ser-
vice, constant improvement in employee
partici- pation
5. Statistical process control metrics
relies on
to analyze results.
6. What is quality management? an approach to uncover customer needs and
expectations and to adjust work to meet
those needs to the highest extent possible
7. What is the PDCA cycle used for? to gather information and test options on a
small
scale before implementing changes on a
large scale
8. Why is it helpful for an organization to It helps to create consistent, predictable
out-
use a process approach in managing its comes.
quality activities?
1/
19
,9. A Pareto chart is a type of . bar chart
10. Supplier-input-process-output- Shows the boundaries of a process and
cus- tomer (SIPOC) diagram defines suppliers - (high level of focus on
the overall process)
2/
19
, C207 WGU - Section 4 - Quality Management Basics
11. Plan-Do-Check-Act Cycle A four-step method that practitioners use to
cre- ate plans to solve a problem (Plan),
run an ex- periment to see if the plan will
work (Do), check the experiment results
(Check), and implement changes to
processes or policies (Act). focused on
continuous improvement.
12. ISO certification verifies an organization meets international
qual- ity standards
13. Prioritization Matrix tools used to organize information that
can be compared on a variety of
characteristics in order to make a
comparison, selection, or choice
14. Six Sigma is a highly disciplined, data-driven
approach for improving quality focused
intently on facts and statistics to reduce
variation - (striving for perfec- tion)
15. Network diagram a graphical tool that shows the logical
linkages between activities in a project
16. Quality Control (QC) A process, such as statistical sampling, that
mon- itors the quality of operations
(reactive)
3/
19
Question and answers already passed 2025/2026
1. A SIPOC diagram helps you
It helps you understand how process
manage quality in which of the
elements fit together.
following ways?
2. Your quality management both the products you make and the
processes should monitor . processes you use to make them
3. Quality management A total commitment by everyone in an
organi- zation to improve the quality of
procedures and products by reducing
waste, errors, and defects.
4. Quality management principles Meeting customers expectations - customer
ser-
vice, constant improvement in employee
partici- pation
5. Statistical process control metrics
relies on
to analyze results.
6. What is quality management? an approach to uncover customer needs and
expectations and to adjust work to meet
those needs to the highest extent possible
7. What is the PDCA cycle used for? to gather information and test options on a
small
scale before implementing changes on a
large scale
8. Why is it helpful for an organization to It helps to create consistent, predictable
out-
use a process approach in managing its comes.
quality activities?
1/
19
,9. A Pareto chart is a type of . bar chart
10. Supplier-input-process-output- Shows the boundaries of a process and
cus- tomer (SIPOC) diagram defines suppliers - (high level of focus on
the overall process)
2/
19
, C207 WGU - Section 4 - Quality Management Basics
11. Plan-Do-Check-Act Cycle A four-step method that practitioners use to
cre- ate plans to solve a problem (Plan),
run an ex- periment to see if the plan will
work (Do), check the experiment results
(Check), and implement changes to
processes or policies (Act). focused on
continuous improvement.
12. ISO certification verifies an organization meets international
qual- ity standards
13. Prioritization Matrix tools used to organize information that
can be compared on a variety of
characteristics in order to make a
comparison, selection, or choice
14. Six Sigma is a highly disciplined, data-driven
approach for improving quality focused
intently on facts and statistics to reduce
variation - (striving for perfec- tion)
15. Network diagram a graphical tool that shows the logical
linkages between activities in a project
16. Quality Control (QC) A process, such as statistical sampling, that
mon- itors the quality of operations
(reactive)
3/
19