Introductory Statistics – Core
Introductory
Concepts,
Statistics
Data Analysis,
– Core
Introductory
Probability,
Concepts,
Statistics
Data
and Distributions
Analysis,
– Core Probability,
Concepts,
Study Guide.pdf
Data
and Distributions
Analysis, Probability,
Study Guide.pdf
and Distributions Study Guide.pdf
Introductory
Statistics – Core
Concepts, Data
Analysis,
Probability, and
Distributions Study
Guide
Introductory Statistics – Core
Introductory
Concepts,
Statistics
Data Analysis,
– Core
Introductory
Probability,
Concepts,
Statistics
Data
and Distributions
Analysis,
– Core Probability,
Concepts,
Study Guide.pdf
Data
and Distributions
Analysis, Probability,
Study Guide.pdf
and Distributions Study Guide.pdf
,Introductory Statistics.pdf Introductory Statistics.pdf Introductory Statistics.pdf
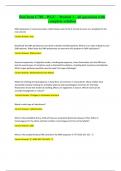
Frequency distribution a tabular summary of data showing the number of each items in each of several
non-overlapping classes
Relative frequency ______ of a class equals the proportion of items belonging to a class; percent
frequency of a class is the relative frequency expressed in percents (multiplied by
100)
Relative (percent) frequency distribution gives a tabular summary of relative (percent) frequency for each class
Bar chart _____ is a graphical representation of categorical data summarised in a frequency,
relative frequency or percent frequency distribution; the bars should be separated
to emphasise that each class is separate
Pie chart provides another such graphical device
histogram ______ is a common graphical presentation of quantitative data summarised in some
frequency distribution; spaces between classes are eliminated to show that all
values in the range of data are possible
Stem-and-leaf display ______ is a technique of exploratory data analysis to show both shape and rank order
of a data set
Introductory Statistics.pdf Introductory Statistics.pdf Introductory Statistics.pdf
, Introductory Statistics.pdf Introductory Statistics.pdf Introductory Statistics.pdf
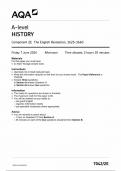
Crosstabulation or contingency table ______ is a tabular summary of data for two variables. Left and top margin labels
define the classes for the two variables. Each observation is associated with a cell.
Simpson's paradox the data in two or more crosstabulations are often combined or aggregated.
Conclusions based on unaggregated data can be reversed
Scatter diagram or scatter plot ______ is a graphical representation of the relationship between two quantitative
variables
Trendline or regression line ______ is the line that provides an approximation of the relationship
Sample statistics ______ are numerical summary measures computed for data from a sample
Additional alternatives to tabular and graphical numerical measures of location, dispersion, shape and association
representations
Measures of location - sample mean
- weighted sample mean
- median
- mode
- quantile or percentile
- 1st quartile & 3rd quartile
Introductory Statistics.pdf Introductory Statistics.pdf Introductory Statistics.pdf
Introductory
Concepts,
Statistics
Data Analysis,
– Core
Introductory
Probability,
Concepts,
Statistics
Data
and Distributions
Analysis,
– Core Probability,
Concepts,
Study Guide.pdf
Data
and Distributions
Analysis, Probability,
Study Guide.pdf
and Distributions Study Guide.pdf
Introductory
Statistics – Core
Concepts, Data
Analysis,
Probability, and
Distributions Study
Guide
Introductory Statistics – Core
Introductory
Concepts,
Statistics
Data Analysis,
– Core
Introductory
Probability,
Concepts,
Statistics
Data
and Distributions
Analysis,
– Core Probability,
Concepts,
Study Guide.pdf
Data
and Distributions
Analysis, Probability,
Study Guide.pdf
and Distributions Study Guide.pdf
,Introductory Statistics.pdf Introductory Statistics.pdf Introductory Statistics.pdf
Frequency distribution a tabular summary of data showing the number of each items in each of several
non-overlapping classes
Relative frequency ______ of a class equals the proportion of items belonging to a class; percent
frequency of a class is the relative frequency expressed in percents (multiplied by
100)
Relative (percent) frequency distribution gives a tabular summary of relative (percent) frequency for each class
Bar chart _____ is a graphical representation of categorical data summarised in a frequency,
relative frequency or percent frequency distribution; the bars should be separated
to emphasise that each class is separate
Pie chart provides another such graphical device
histogram ______ is a common graphical presentation of quantitative data summarised in some
frequency distribution; spaces between classes are eliminated to show that all
values in the range of data are possible
Stem-and-leaf display ______ is a technique of exploratory data analysis to show both shape and rank order
of a data set
Introductory Statistics.pdf Introductory Statistics.pdf Introductory Statistics.pdf
, Introductory Statistics.pdf Introductory Statistics.pdf Introductory Statistics.pdf
Crosstabulation or contingency table ______ is a tabular summary of data for two variables. Left and top margin labels
define the classes for the two variables. Each observation is associated with a cell.
Simpson's paradox the data in two or more crosstabulations are often combined or aggregated.
Conclusions based on unaggregated data can be reversed
Scatter diagram or scatter plot ______ is a graphical representation of the relationship between two quantitative
variables
Trendline or regression line ______ is the line that provides an approximation of the relationship
Sample statistics ______ are numerical summary measures computed for data from a sample
Additional alternatives to tabular and graphical numerical measures of location, dispersion, shape and association
representations
Measures of location - sample mean
- weighted sample mean
- median
- mode
- quantile or percentile
- 1st quartile & 3rd quartile
Introductory Statistics.pdf Introductory Statistics.pdf Introductory Statistics.pdf