
Case Number 2001.2
The Kalamazoo Zoo
Teaching Note
This case is used to introduce the concept of variance analysis.
Key points:
Demonstrate the value of variance in budgeting
Variance can be performed on both revenues and expenditure
Variance is bi-directional and can be favorable or unfavorable for both revenues and expenditures
Total variance can be decomposed into quantity and price variance
Variance analysis requires some operating information
Show how variance analysis can proceed at successive levels of detail and insight
Variance is ex-post
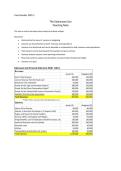
Kalamazoo Zoo (Financial Statement 2010) Table 1
Revenues:
Actual ($) Budgeted ($)
Gate Ticket Revenue 100,000 120,000
License Revenue from the food court 100,000 100,000
Donations from individuals 50,000 100,000
Grants for the Tiger Conservation Project* 180,000 150,000
Grants for the Rhino Conservation Project* 100,000 100,000
Grants for the Yellow-billed Cuckoo Conservation Project* 120,000 100,000
Subsidies from the state government 200,000 150,000
Total Revenues 850,000 820,000
*Federal funds received under Endangered Species Act
Expenses:
Actual ($) Budgeted ($)
Salary of Zoo Director 80,000 80,000
Salaries of Assistant Zoo Keepers (2 keepers total) 100,000 100,000
Wages and Salary for Animal Handlers 100,000 100,000
Security, Office and Support staff Wages 50,000 50,000
Fringe Benefits cost for employees (health insurance, etc.) 130,000 130,000
Food and Provision costs for animals 360,000 240,000
Overtime costs 100,000 40,000
Utilities 50,000 30,000
Transportation and facilities for visitors 100,000 50,000
Total Expenses 1,070,000 820,000
, QUESTION 1
The first question asks students to apparently simple total variance. Even at this level of analysis, however,
students quickly will realize that the Zoo faces a big expenditure problem caused by a larger than expected number
of animals consuming more food (or more expensive food) than expected. They will come back to discuss this
point when they consider the possible choices in Question 3.
Perform a Total Variance Analysis using template #1:
Variance Type Actual Budget Variance Amount Favorable/Unfavorable
Revenue Variance 850,000 820,000 30,000 FAV
Expenditure 1,070,000 820,000 (250,000) UNFAV
Variance
Total Variance = (220,000)
QUESTION 2
In the second question, students use the operating information in Table 2A to perform a simple quantity variance
on the revenues obtained from ticket revenue. Using the quantity variance formula:(AQ-EQ)*EP students can
quickly discover that the zoo sold fewer tickets than expected (unfavorable). Using the price variance formula (AP-
EP)*AP, students will discover that the Zoo sold tickets at a higher price than expected (favorable). Therefore, they
can see that the price effect offset the unfavorable quantity -- making it easy to overlook this problem. Again,
students will come back to this topic during the discussion for Question 3.
I also make sure that students see that the sum of the quantity and price variance for revenue ticket variance will
equal the total ticket revenue variance, so they can always check their answers.
The higher-than-expected ticket price will be an opportunity to discuss why an organization might not be able to
forecast the price of tickets. I explain that for many organizations, the price point will be an average of many
different tickets -- for example, senior, student, adult and child prices, group discounts, etc. This introduces the
larger issue of how to determine expected revenues. I teach revenue forecasting techniques later on in the course,
so this issue is revisited later on.
In Question 2B, students perform a simple expenditure variance on the quantity and price of food consumed by
the animals. Students will find that the Zoo served more (or higher priced) food to more animals, both unfavorable
variances. They will then be able to see that the food expenditure is only partially explained by the quantity of
animals. This will lead them to wonder whether the animals consumed more food or was the food higher priced?
I use this opportunity to introduce the concept of "mix" variance, explaining that the variance could also be
explained by a different mix of animals (more tigers, fewer birds?) than expected.
HKS Case Program 2 of 7 Case Number 2001.2
The Kalamazoo Zoo
Teaching Note
This case is used to introduce the concept of variance analysis.
Key points:
Demonstrate the value of variance in budgeting
Variance can be performed on both revenues and expenditure
Variance is bi-directional and can be favorable or unfavorable for both revenues and expenditures
Total variance can be decomposed into quantity and price variance
Variance analysis requires some operating information
Show how variance analysis can proceed at successive levels of detail and insight
Variance is ex-post
Kalamazoo Zoo (Financial Statement 2010) Table 1
Revenues:
Actual ($) Budgeted ($)
Gate Ticket Revenue 100,000 120,000
License Revenue from the food court 100,000 100,000
Donations from individuals 50,000 100,000
Grants for the Tiger Conservation Project* 180,000 150,000
Grants for the Rhino Conservation Project* 100,000 100,000
Grants for the Yellow-billed Cuckoo Conservation Project* 120,000 100,000
Subsidies from the state government 200,000 150,000
Total Revenues 850,000 820,000
*Federal funds received under Endangered Species Act
Expenses:
Actual ($) Budgeted ($)
Salary of Zoo Director 80,000 80,000
Salaries of Assistant Zoo Keepers (2 keepers total) 100,000 100,000
Wages and Salary for Animal Handlers 100,000 100,000
Security, Office and Support staff Wages 50,000 50,000
Fringe Benefits cost for employees (health insurance, etc.) 130,000 130,000
Food and Provision costs for animals 360,000 240,000
Overtime costs 100,000 40,000
Utilities 50,000 30,000
Transportation and facilities for visitors 100,000 50,000
Total Expenses 1,070,000 820,000
, QUESTION 1
The first question asks students to apparently simple total variance. Even at this level of analysis, however,
students quickly will realize that the Zoo faces a big expenditure problem caused by a larger than expected number
of animals consuming more food (or more expensive food) than expected. They will come back to discuss this
point when they consider the possible choices in Question 3.
Perform a Total Variance Analysis using template #1:
Variance Type Actual Budget Variance Amount Favorable/Unfavorable
Revenue Variance 850,000 820,000 30,000 FAV
Expenditure 1,070,000 820,000 (250,000) UNFAV
Variance
Total Variance = (220,000)
QUESTION 2
In the second question, students use the operating information in Table 2A to perform a simple quantity variance
on the revenues obtained from ticket revenue. Using the quantity variance formula:(AQ-EQ)*EP students can
quickly discover that the zoo sold fewer tickets than expected (unfavorable). Using the price variance formula (AP-
EP)*AP, students will discover that the Zoo sold tickets at a higher price than expected (favorable). Therefore, they
can see that the price effect offset the unfavorable quantity -- making it easy to overlook this problem. Again,
students will come back to this topic during the discussion for Question 3.
I also make sure that students see that the sum of the quantity and price variance for revenue ticket variance will
equal the total ticket revenue variance, so they can always check their answers.
The higher-than-expected ticket price will be an opportunity to discuss why an organization might not be able to
forecast the price of tickets. I explain that for many organizations, the price point will be an average of many
different tickets -- for example, senior, student, adult and child prices, group discounts, etc. This introduces the
larger issue of how to determine expected revenues. I teach revenue forecasting techniques later on in the course,
so this issue is revisited later on.
In Question 2B, students perform a simple expenditure variance on the quantity and price of food consumed by
the animals. Students will find that the Zoo served more (or higher priced) food to more animals, both unfavorable
variances. They will then be able to see that the food expenditure is only partially explained by the quantity of
animals. This will lead them to wonder whether the animals consumed more food or was the food higher priced?
I use this opportunity to introduce the concept of "mix" variance, explaining that the variance could also be
explained by a different mix of animals (more tigers, fewer birds?) than expected.
HKS Case Program 2 of 7 Case Number 2001.2


