

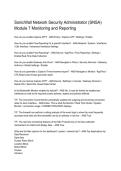
SonicWall Network Security Administrator
SonicWall(SNSA)
Network
Module
Security
7 Monitoring
Administrator
SonicWall
and(SNSA)
Reporting.pdf
NetworkModule
Security
7 Monitoring
Administrator
and(SNSA)
Reporting.pdf
Module 7 Monitoring and Reporting.pdf
SonicWall Network Security Administrator (SNSA)
Module 7 Monitoring and Reporting
How do you enable Capture ATP? - ANS-Policy / Capture ATP / Settings / Enable
How do you enable Flow Reporting for a specific interface? - ANS-Network / System / Interfaces
/ Edit Interface / Advanced Interfaces Settings
How do you enable Flow Reporting? - ANS-Device / AppFlow / Flow Reporting / Settings /
Enable Real-Time Data Collection
How do you enable Gateway Anti-Virus? - ANS-Navigate to Policy / Security Services / Gateway
Antivirus / Global Settings / Enable
How do you genertate a Capture Threat Assment report? - ANS-Navigate to Monitor / AppFlow /
CTA Report and choose generate report
How do you license Capture ATP? - ANS-Device / Settings / Licenses / Gateway Services /
Needs Info / Select the closest Data Center
Is the Bandwidth Monitor enabled by defualt? - ANS-No, it must be further be enabled per
interfaces as well as the required access policies, objects and policies defined.
T/F: The connection Count Monitor periodically updates the outgoing and incoming connection
rates for each interface. - ANS-False. This is what the Monitor / Real Time Charts / System
Monitor / connection usage / CONNECTION RATE displays
T/F: The forewall can perform a rolling analysis of the event logs to show the most frequently
accessed web sites and the bandwidth use by ip address or service. - ANS-True
T/F: The real time monitoring features of the NSV Firewall rely on the flow-collection
mechanisms to collect and display data. - ANS-True
What are the filter options for the dashboard / system / network tab? - ANS-Top Applications by:
Data Received
Data Sent
Access Rules Block
Location Block
Botnet Block
Viruses
Intrusion
SonicWall Network Security Administrator
SonicWall(SNSA)
Network
Module
Security
7 Monitoring
Administrator
SonicWall
and(SNSA)
Reporting.pdf
NetworkModule
Security
7 Monitoring
Administrator
and(SNSA)
Reporting.pdf
Module 7 Monitoring and Reporting.pdf
,SonicWall Network Security Administrator
SonicWall(SNSA)
Network
Module
Security
7 Monitoring
Administrator
SonicWall
and(SNSA)
Reporting.pdf
NetworkModule
Security
7 Monitoring
Administrator
and(SNSA)
Reporting.pdf
Module 7 Monitoring and Reporting.pdf
Spyware
What are the top-level tabs for Monitor / AppFlow / Appflow Report? - ANS-Applications
Users
IP Addresses
Virus
Intrusions
Spyware
Locations
Botnets
Web Categories
What are the two graphs show on the Monitor / Real Time Charts / System Monitor / System
Monitor Tab? - ANS-Multi-Core Monitor
Applications
What can the System Monitor refresh rate be configured to? - ANS-3 - 30 seconds
What does the configure schedule button do at Monitor / AppFlow / Appflow Report? -
ANS-Allows the admin to schedule reports to be delivered through FTP or by email for a set
date range
What does the Monitor / Real Time Charts / Protocol Monitor display? - ANS-Displays protocol
inbound and outbound bandwidth traffic
ARP
TCP
IPv4
What does the Monitor / Real Time Charts / System Monitor / connection usage /
CONNECTION RATE display? - ANS-Periodically updates the outgoing and incoming
connection rates for each interface.
What does the Monitor / Real Time Charts / System Monitor / Interface usage tab display? -
ANS-provides a granular representation of incoming and outgoing bandwidth traffic as well as
the respective packet rates and sizes
What does the Monitor / Real Time Charts / User Monitor display? - ANS-Displays the number
of active users on the sonicwall
What does the Monitor /Real Time Charts / BWM Monitor display? - ANS-When Bandwidth
management is enabled, this monitor displays policy-based usage for ingress and egress
network traffic and a second chart for policy-based bandwidth usage.
SonicWall Network Security Administrator
SonicWall(SNSA)
Network
Module
Security
7 Monitoring
Administrator
SonicWall
and(SNSA)
Reporting.pdf
NetworkModule
Security
7 Monitoring
Administrator
and(SNSA)
Reporting.pdf
Module 7 Monitoring and Reporting.pdf
, SonicWall Network Security Administrator
SonicWall(SNSA)
Network
Module
Security
7 Monitoring
Administrator
SonicWall
and(SNSA)
Reporting.pdf
NetworkModule
Security
7 Monitoring
Administrator
and(SNSA)
Reporting.pdf
Module 7 Monitoring and Reporting.pdf
What does the Network tab display in the Dashboard? - ANS-Provides session reporting
windows that display top application, addresses, users, website ratings, countries and so on.
What does the observed threats in the Dashboard Summary Tab display? - ANS-Tracks the
number of system connections reporting triggered threats.
What does the Top Users in the Dashboard Summary Tab display? - ANS-Provides data as it
relates to the users connected to the system. You can track user level transactions and activities
by filtering on several different options, including sessions, bytes received, bytes sent, and bytes
blocked.
What does the Traffic Distribution in the Dashboard Summary Tab display? - ANS-All traffic
within your infrastructure including threats and locations. It shows a summary of traffic passing
through the firewall based on protocols.
What is Capture ATP? - ANS-Cloud Based Network Sandbox the analyzes suspicious code
Licensed Cloud Based Multi Engine Solution
Detects and Blocks Zero Day Attacks
Combines multi-layer sandboxing, including full system emulation and virtualization to analyze
suspicious code behavior
What is required for application data to be displayed on the Monitor / Real Time Charts / System
Monitor / Application Bandwidth tab? - ANS-App Control must be enabled
What is the default interface show in Monitor / Real Time Charts / System Monitor / interface
usage? - ANS-All interfaces
What is the Monitor /Real Time Charts / BWM Monitor refresh interval options? - ANS-3 - 30
seconds
What questions does the Monitor / AppFlow / Appflow Report answer? - ANS-What are the
topmost used applications running on my network?
which applications in terms of total number of sessions and bytes consume my network
bandwidth?
Which applications have viruses intrusions and spyware?
What website categories are my users visiting?
What Threat Types are included in the dashboard / system / threat tab? - ANS-Top:
Intrusions
Virus
Spyware
Botnets
SonicWall Network Security Administrator
SonicWall(SNSA)
Network
Module
Security
7 Monitoring
Administrator
SonicWall
and(SNSA)
Reporting.pdf
NetworkModule
Security
7 Monitoring
Administrator
and(SNSA)
Reporting.pdf
Module 7 Monitoring and Reporting.pdf
SonicWall(SNSA)
Network
Module
Security
7 Monitoring
Administrator
SonicWall
and(SNSA)
Reporting.pdf
NetworkModule
Security
7 Monitoring
Administrator
and(SNSA)
Reporting.pdf
Module 7 Monitoring and Reporting.pdf
SonicWall Network Security Administrator (SNSA)
Module 7 Monitoring and Reporting
How do you enable Capture ATP? - ANS-Policy / Capture ATP / Settings / Enable
How do you enable Flow Reporting for a specific interface? - ANS-Network / System / Interfaces
/ Edit Interface / Advanced Interfaces Settings
How do you enable Flow Reporting? - ANS-Device / AppFlow / Flow Reporting / Settings /
Enable Real-Time Data Collection
How do you enable Gateway Anti-Virus? - ANS-Navigate to Policy / Security Services / Gateway
Antivirus / Global Settings / Enable
How do you genertate a Capture Threat Assment report? - ANS-Navigate to Monitor / AppFlow /
CTA Report and choose generate report
How do you license Capture ATP? - ANS-Device / Settings / Licenses / Gateway Services /
Needs Info / Select the closest Data Center
Is the Bandwidth Monitor enabled by defualt? - ANS-No, it must be further be enabled per
interfaces as well as the required access policies, objects and policies defined.
T/F: The connection Count Monitor periodically updates the outgoing and incoming connection
rates for each interface. - ANS-False. This is what the Monitor / Real Time Charts / System
Monitor / connection usage / CONNECTION RATE displays
T/F: The forewall can perform a rolling analysis of the event logs to show the most frequently
accessed web sites and the bandwidth use by ip address or service. - ANS-True
T/F: The real time monitoring features of the NSV Firewall rely on the flow-collection
mechanisms to collect and display data. - ANS-True
What are the filter options for the dashboard / system / network tab? - ANS-Top Applications by:
Data Received
Data Sent
Access Rules Block
Location Block
Botnet Block
Viruses
Intrusion
SonicWall Network Security Administrator
SonicWall(SNSA)
Network
Module
Security
7 Monitoring
Administrator
SonicWall
and(SNSA)
Reporting.pdf
NetworkModule
Security
7 Monitoring
Administrator
and(SNSA)
Reporting.pdf
Module 7 Monitoring and Reporting.pdf
,SonicWall Network Security Administrator
SonicWall(SNSA)
Network
Module
Security
7 Monitoring
Administrator
SonicWall
and(SNSA)
Reporting.pdf
NetworkModule
Security
7 Monitoring
Administrator
and(SNSA)
Reporting.pdf
Module 7 Monitoring and Reporting.pdf
Spyware
What are the top-level tabs for Monitor / AppFlow / Appflow Report? - ANS-Applications
Users
IP Addresses
Virus
Intrusions
Spyware
Locations
Botnets
Web Categories
What are the two graphs show on the Monitor / Real Time Charts / System Monitor / System
Monitor Tab? - ANS-Multi-Core Monitor
Applications
What can the System Monitor refresh rate be configured to? - ANS-3 - 30 seconds
What does the configure schedule button do at Monitor / AppFlow / Appflow Report? -
ANS-Allows the admin to schedule reports to be delivered through FTP or by email for a set
date range
What does the Monitor / Real Time Charts / Protocol Monitor display? - ANS-Displays protocol
inbound and outbound bandwidth traffic
ARP
TCP
IPv4
What does the Monitor / Real Time Charts / System Monitor / connection usage /
CONNECTION RATE display? - ANS-Periodically updates the outgoing and incoming
connection rates for each interface.
What does the Monitor / Real Time Charts / System Monitor / Interface usage tab display? -
ANS-provides a granular representation of incoming and outgoing bandwidth traffic as well as
the respective packet rates and sizes
What does the Monitor / Real Time Charts / User Monitor display? - ANS-Displays the number
of active users on the sonicwall
What does the Monitor /Real Time Charts / BWM Monitor display? - ANS-When Bandwidth
management is enabled, this monitor displays policy-based usage for ingress and egress
network traffic and a second chart for policy-based bandwidth usage.
SonicWall Network Security Administrator
SonicWall(SNSA)
Network
Module
Security
7 Monitoring
Administrator
SonicWall
and(SNSA)
Reporting.pdf
NetworkModule
Security
7 Monitoring
Administrator
and(SNSA)
Reporting.pdf
Module 7 Monitoring and Reporting.pdf
, SonicWall Network Security Administrator
SonicWall(SNSA)
Network
Module
Security
7 Monitoring
Administrator
SonicWall
and(SNSA)
Reporting.pdf
NetworkModule
Security
7 Monitoring
Administrator
and(SNSA)
Reporting.pdf
Module 7 Monitoring and Reporting.pdf
What does the Network tab display in the Dashboard? - ANS-Provides session reporting
windows that display top application, addresses, users, website ratings, countries and so on.
What does the observed threats in the Dashboard Summary Tab display? - ANS-Tracks the
number of system connections reporting triggered threats.
What does the Top Users in the Dashboard Summary Tab display? - ANS-Provides data as it
relates to the users connected to the system. You can track user level transactions and activities
by filtering on several different options, including sessions, bytes received, bytes sent, and bytes
blocked.
What does the Traffic Distribution in the Dashboard Summary Tab display? - ANS-All traffic
within your infrastructure including threats and locations. It shows a summary of traffic passing
through the firewall based on protocols.
What is Capture ATP? - ANS-Cloud Based Network Sandbox the analyzes suspicious code
Licensed Cloud Based Multi Engine Solution
Detects and Blocks Zero Day Attacks
Combines multi-layer sandboxing, including full system emulation and virtualization to analyze
suspicious code behavior
What is required for application data to be displayed on the Monitor / Real Time Charts / System
Monitor / Application Bandwidth tab? - ANS-App Control must be enabled
What is the default interface show in Monitor / Real Time Charts / System Monitor / interface
usage? - ANS-All interfaces
What is the Monitor /Real Time Charts / BWM Monitor refresh interval options? - ANS-3 - 30
seconds
What questions does the Monitor / AppFlow / Appflow Report answer? - ANS-What are the
topmost used applications running on my network?
which applications in terms of total number of sessions and bytes consume my network
bandwidth?
Which applications have viruses intrusions and spyware?
What website categories are my users visiting?
What Threat Types are included in the dashboard / system / threat tab? - ANS-Top:
Intrusions
Virus
Spyware
Botnets
SonicWall Network Security Administrator
SonicWall(SNSA)
Network
Module
Security
7 Monitoring
Administrator
SonicWall
and(SNSA)
Reporting.pdf
NetworkModule
Security
7 Monitoring
Administrator
and(SNSA)
Reporting.pdf
Module 7 Monitoring and Reporting.pdf


