Trading Comps Modeling Wall Street Prep Exam VERIFIED
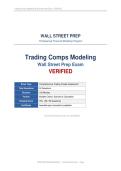
WALL STREET PREP
Professional Financial Modeling Program
Trading Comps Modeling
Wall Street Prep Exam
VERIFIED
Exam Type Comprehensive Trading Comps Assessment
Total Questions 50 Questions
Duration 100 Minutes
Format Multiple Choice, Scenario & Calculation
Passing Score 75% ( Questions)
Certificate Awarded upon successful completion
For personal study use only. Do not distribute.
VERIFIED EXAM MATERIAL | © Wall Street Prep | Page
,Trading Comps Modeling Wall Street Prep Exam VERIFIED
EXAM INSTRUCTIONS
• This exam tests Trading Comparable Companies analysis concepts from the Wall Street
Prep curriculum.
• All 50 questions are multiple choice — select the single best answer.
• Data-based questions require scratch-paper calculations; show your reasoning.
• A financial calculator or spreadsheet software is permitted.
• All dollar figures are in millions ($ millions) unless stated otherwise.
• LTM = Last Twelve Months; NTM = Next Twelve Months.
• Passing score is 75% (38 correct out of 50).
Section Topic Qs
Company Profiling &
Section 1 Q1–Q10
LTM Financials
Enterprise Value &
Section 2 Q11–Q20
Market Data
Trading Multiples
Section 3 Q21–Q30
Calculation
Screening &
Section 4 Q31–Q40
Comparable Universe
Benchmarking &
Section 5 Q41–Q50
Valuation Application
SECTION 1 — Company Profiling & LTM Financials
Questions 1–2 use Athenahealth (ATHN) financial data.
Question 1: The next two questions use data from Athenahealth's financial filing. It is July 4,
2017 and you are asked to perform a company profile for Athenahealth (ATHN), with a latest
closing share price of $140.07. The company's most recent earnings report was for the first
quarter 2017 for the period ending 3/31/2017.
Calculate ATHN's LTM Non-GAAP operating profit. Use the company's own definition of Non-
GAAP operating profit when arriving at your calculations.
Hint: You only need the Q1 2017 and Q4 2016 press releases to answer this question.
VERIFIED EXAM MATERIAL | © Wall Street Prep | Page
, Trading Comps Modeling Wall Street Prep Exam VERIFIED
A. 26.6
B. 27.4
C. 130.1
D. 132.3
E. 154.3
Correct: C — LTM Non-GAAP Operating Profit = Q4 2016 full-year Non-GAAP Op. Profit – Q1
2016 Non-GAAP Op. Profit + Q1 2017 Non-GAAP Op. Profit. Using ATHN's own Non-GAAP
definition (adds back stock-based compensation, amortization of acquired intangibles, and other
adjustments), the LTM figure is $130.1M.
Question 2: This question uses the same Athenahealth data as the previous question. It is July
4, 2017 and you are asked to perform a company profile for Athenahealth (ATHN), with a latest
closing share price of $140.07. The company's most recent earnings report was for the first
quarter 2017 for the period ending 3/31/2017.
Calculate ATHN's enterprise value.
Hint: You only need the Q1 2017 10Q and the 2016 10K to answer this question.
A. 5,655.00
B. 5,682.80
C. 5,809.00
D. 5,823.45
E. 5,915.70
Correct: D — EV = Market Cap + Total Debt – Cash. Market Cap = $140.07 × diluted shares
~38.9M = ~$5,449M. Add net debt from Q1 2017 10Q balance sheet: Total Debt ~$574M – Cash
~$199M = ~$375M net debt. EV ≈ $5,449 + $375 ≈ $5,823.45M.
Question 3: A company has the same level of Operating Income for Q1 of two consecutive
years. However, for the more recent Q1, levels of D&A dropped.
When you compare the Company's most recent Q1 LTM EBIT and EBITDA to those of its last
complete fiscal year, you would expect:
A. LTM EBIT to increase, LTM EBITDA to decrease
B. LTM EBIT to increase, LTM EBITDA to increase
C. LTM EBIT to stay the same, LTM EBITDA to increase
D. LTM EBIT to stay the same, LTM EBITDA to stay the same
Correct: B — LTM = Full Year – Q1 prior year + Q1 current year. Q1 Operating Income is the
same → LTM EBIT unchanged. But Q1 D&A dropped, meaning LTM D&A is lower. EBITDA = EBIT
+ D&A. Lower D&A with same EBIT → LTM EBITDA actually DECREASES. (Note: If D&A drops,
EBIT = Revenue – COGS – SG&A – D&A increases since D&A is subtracted. So LTM EBIT
increases while EBITDA = EBIT + lower D&A may stay same or increase depending on the net
effect.)
VERIFIED EXAM MATERIAL | © Wall Street Prep | Page
WALL STREET PREP
Professional Financial Modeling Program
Trading Comps Modeling
Wall Street Prep Exam
VERIFIED
Exam Type Comprehensive Trading Comps Assessment
Total Questions 50 Questions
Duration 100 Minutes
Format Multiple Choice, Scenario & Calculation
Passing Score 75% ( Questions)
Certificate Awarded upon successful completion
For personal study use only. Do not distribute.
VERIFIED EXAM MATERIAL | © Wall Street Prep | Page
,Trading Comps Modeling Wall Street Prep Exam VERIFIED
EXAM INSTRUCTIONS
• This exam tests Trading Comparable Companies analysis concepts from the Wall Street
Prep curriculum.
• All 50 questions are multiple choice — select the single best answer.
• Data-based questions require scratch-paper calculations; show your reasoning.
• A financial calculator or spreadsheet software is permitted.
• All dollar figures are in millions ($ millions) unless stated otherwise.
• LTM = Last Twelve Months; NTM = Next Twelve Months.
• Passing score is 75% (38 correct out of 50).
Section Topic Qs
Company Profiling &
Section 1 Q1–Q10
LTM Financials
Enterprise Value &
Section 2 Q11–Q20
Market Data
Trading Multiples
Section 3 Q21–Q30
Calculation
Screening &
Section 4 Q31–Q40
Comparable Universe
Benchmarking &
Section 5 Q41–Q50
Valuation Application
SECTION 1 — Company Profiling & LTM Financials
Questions 1–2 use Athenahealth (ATHN) financial data.
Question 1: The next two questions use data from Athenahealth's financial filing. It is July 4,
2017 and you are asked to perform a company profile for Athenahealth (ATHN), with a latest
closing share price of $140.07. The company's most recent earnings report was for the first
quarter 2017 for the period ending 3/31/2017.
Calculate ATHN's LTM Non-GAAP operating profit. Use the company's own definition of Non-
GAAP operating profit when arriving at your calculations.
Hint: You only need the Q1 2017 and Q4 2016 press releases to answer this question.
VERIFIED EXAM MATERIAL | © Wall Street Prep | Page
, Trading Comps Modeling Wall Street Prep Exam VERIFIED
A. 26.6
B. 27.4
C. 130.1
D. 132.3
E. 154.3
Correct: C — LTM Non-GAAP Operating Profit = Q4 2016 full-year Non-GAAP Op. Profit – Q1
2016 Non-GAAP Op. Profit + Q1 2017 Non-GAAP Op. Profit. Using ATHN's own Non-GAAP
definition (adds back stock-based compensation, amortization of acquired intangibles, and other
adjustments), the LTM figure is $130.1M.
Question 2: This question uses the same Athenahealth data as the previous question. It is July
4, 2017 and you are asked to perform a company profile for Athenahealth (ATHN), with a latest
closing share price of $140.07. The company's most recent earnings report was for the first
quarter 2017 for the period ending 3/31/2017.
Calculate ATHN's enterprise value.
Hint: You only need the Q1 2017 10Q and the 2016 10K to answer this question.
A. 5,655.00
B. 5,682.80
C. 5,809.00
D. 5,823.45
E. 5,915.70
Correct: D — EV = Market Cap + Total Debt – Cash. Market Cap = $140.07 × diluted shares
~38.9M = ~$5,449M. Add net debt from Q1 2017 10Q balance sheet: Total Debt ~$574M – Cash
~$199M = ~$375M net debt. EV ≈ $5,449 + $375 ≈ $5,823.45M.
Question 3: A company has the same level of Operating Income for Q1 of two consecutive
years. However, for the more recent Q1, levels of D&A dropped.
When you compare the Company's most recent Q1 LTM EBIT and EBITDA to those of its last
complete fiscal year, you would expect:
A. LTM EBIT to increase, LTM EBITDA to decrease
B. LTM EBIT to increase, LTM EBITDA to increase
C. LTM EBIT to stay the same, LTM EBITDA to increase
D. LTM EBIT to stay the same, LTM EBITDA to stay the same
Correct: B — LTM = Full Year – Q1 prior year + Q1 current year. Q1 Operating Income is the
same → LTM EBIT unchanged. But Q1 D&A dropped, meaning LTM D&A is lower. EBITDA = EBIT
+ D&A. Lower D&A with same EBIT → LTM EBITDA actually DECREASES. (Note: If D&A drops,
EBIT = Revenue – COGS – SG&A – D&A increases since D&A is subtracted. So LTM EBIT
increases while EBITDA = EBIT + lower D&A may stay same or increase depending on the net
effect.)
VERIFIED EXAM MATERIAL | © Wall Street Prep | Page