

Section 10.2 - Comparing Two Means (pp. 634-653)
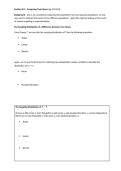
Background - Just as we considered comparing the proportions from two separate populations, we also
may want to compare the means of two different populations. Again this might be looking at the results
of random sampling or experimentation.
The Sampling Distribution of a Difference between Two Means
From Chapter 7, we saw that the sampling distribution of x has the following properties:
Shape:
Center:
Spread:
Again, we can use the formulas for combining two independent random variables to describe the
distribution of x 1−x 2 :
Mean:
Standard Deviation:
The Sampling Distribution of x 1−x 2
Choose an SRS of size n1 from Population 1 with mean 1 and standard deviation 1 and an independent
SRS of size n2 from Population 2 with mean 2 and standard deviation 2.
Shape:
Center:
Spread:
, Example - The Hyena Potato Chip Company buys potatoes from two different suppliers, Riderwood
Farms and Camberley, Inc. The weights of the potatoes from Riderwood are approximately Normally
distributed with a mean of 175 grams and a standard deviation of 25 grams. The weights of the
potatoes from Camberley are approximately Normally distributed with a mean of 180 grams and a
standard deviation of 30 grams. When the shipments arrive at the factory, inspectors randomly select a
sample of 20 potatoes from each shipment and weigh them. They are surprised when the average
weight of potatoes from Riderwood x r is higher than the average weight of the potatoes from
Camberley x c .
a. Describe the shape, center and spread of the sampling distribution of x c −x r .
b. Find the probability that the mean weight of the Riderwood sample is larger than the mean weight of
the Camberley sample. Should the inspectors have been surprised?
HW: 25-28, 31, 33, 35, 51
Confidence Intervals for x 1−x 2
Estimate Two –sample t interval for 1-2 (2-SampTInt) Random: Data from random
samples or randomized
√ s12 s22 experiment
¿
( x 1−x 2 ) ±t +
n 1 n1 Normal: Population distributions
Normal or large samples (n1≥30,
df = min(n1 - 1, n2 - 1) n2≥30)
Independent: Observations and
independent samples or groups;
10% condition if sampling
without replacement
Background - Just as we considered comparing the proportions from two separate populations, we also
may want to compare the means of two different populations. Again this might be looking at the results
of random sampling or experimentation.
The Sampling Distribution of a Difference between Two Means
From Chapter 7, we saw that the sampling distribution of x has the following properties:
Shape:
Center:
Spread:
Again, we can use the formulas for combining two independent random variables to describe the
distribution of x 1−x 2 :
Mean:
Standard Deviation:
The Sampling Distribution of x 1−x 2
Choose an SRS of size n1 from Population 1 with mean 1 and standard deviation 1 and an independent
SRS of size n2 from Population 2 with mean 2 and standard deviation 2.
Shape:
Center:
Spread:
, Example - The Hyena Potato Chip Company buys potatoes from two different suppliers, Riderwood
Farms and Camberley, Inc. The weights of the potatoes from Riderwood are approximately Normally
distributed with a mean of 175 grams and a standard deviation of 25 grams. The weights of the
potatoes from Camberley are approximately Normally distributed with a mean of 180 grams and a
standard deviation of 30 grams. When the shipments arrive at the factory, inspectors randomly select a
sample of 20 potatoes from each shipment and weigh them. They are surprised when the average
weight of potatoes from Riderwood x r is higher than the average weight of the potatoes from
Camberley x c .
a. Describe the shape, center and spread of the sampling distribution of x c −x r .
b. Find the probability that the mean weight of the Riderwood sample is larger than the mean weight of
the Camberley sample. Should the inspectors have been surprised?
HW: 25-28, 31, 33, 35, 51
Confidence Intervals for x 1−x 2
Estimate Two –sample t interval for 1-2 (2-SampTInt) Random: Data from random
samples or randomized
√ s12 s22 experiment
¿
( x 1−x 2 ) ±t +
n 1 n1 Normal: Population distributions
Normal or large samples (n1≥30,
df = min(n1 - 1, n2 - 1) n2≥30)
Independent: Observations and
independent samples or groups;
10% condition if sampling
without replacement


