

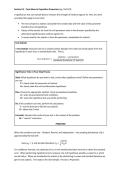
Section 9.2 - Tests About a Population Proportion (pp. 554-574)
A significance test uses sample data to measure the strength of evidence against H0. Here are some
principles that apply to most tests:
The test compares a statistic calculated from sample data with the value of the parameter
stated by the null hypothesis.
Values of the statistic far from the null parameter value in the direction specified by the
alternative hypothesis give evidence against H0.
To assess how far the statistic is from the parameter, standardize the statistic.
Test Statistic
A test statistic measures how far a sample statistic diverges from what we would expect if the null
hypothesis H0 were true, in standardized units. That is,
𝑠𝑡𝑎𝑡𝑖𝑠𝑡𝑖𝑐 − 𝑝𝑎𝑟𝑎𝑚𝑒𝑡𝑒𝑟
𝑡𝑒𝑠𝑡 𝑠𝑡𝑎𝑡𝑖𝑠𝑡𝑖𝑐 =
𝑠𝑡𝑎𝑛𝑑𝑎𝑟𝑑 𝑑𝑒𝑣𝑖𝑎𝑡𝑖𝑜𝑛 𝑜𝑓 𝑠𝑡𝑎𝑡𝑖𝑠𝑡𝑖𝑐
Significance Tests: A Four-Step Process
State: What hypotheses do you want to test, and at what significance level? Define any parameters
you use.
P = clearly state the parameter of interest
H = clearly state the null and alternative hypotheses
Plan: Choose the appropriate method. Check assumptions/conditions.
A = write all assumptions/check conditions
N = name the hypothesis test you will be performing
Do: If the conditions are met, perform the calculations.
T = use the formula to find the test statistic
O = obtain the P-value
Conclude: Interpret the results of your test in the context of the problem.
M = “mantra” conclusion
PHANTOM
When the conditions are met -- Random, Normal, and Independent -- the sampling distribution of 𝑝̂ is
approximately Normal with
𝑝(1−𝑝)
mean 𝜇𝑝̂ = 𝑝 and standard deviation 𝜎𝑝̂ = √ 𝑛
For confidence intervals, we substitute 𝑝̂ for p in the standard deviation formula to obtain the standard
error. When performing significance tests, however, the null hypothesis specifies a value for p, which
we will call p0. When we standardize the statistic 𝑝̂ by substituting its mean and standard deviation we
get the test statistic. This leads to the One-Sample z-Test for a Proportion.
, One-Sample z-Test for a Proportion
Choose an SRS of size n from a large population that contains and unknown proportion p of successes.
To test the hypothesis H0: p = p0, compute the z-statistic:
𝑝̂ − 𝑝0
𝑧=
√𝑝0 (1 − 𝑝0 )
𝑛
Finding the P-value by calculating the probability of getting a z statistic this large or larger in the
direction specified by the alternative hypothesis HA.
Example (One-tailed test) - On shows like American Idol, contestants often wonder if there is an
advantage to performing last. To investigate this, a random sample of 600 AI fans is selected to view the
audition tapes of 12 never-before-seen contestants. For each fan, the order of the 12 videos is
randomly determined. Thus, if the order of performance does not matter, we would expect exactly ½ of
the fans to prefer the last contestant they viewed. Do these data provide convincing evidence that
there is an advantage to going last?
A significance test uses sample data to measure the strength of evidence against H0. Here are some
principles that apply to most tests:
The test compares a statistic calculated from sample data with the value of the parameter
stated by the null hypothesis.
Values of the statistic far from the null parameter value in the direction specified by the
alternative hypothesis give evidence against H0.
To assess how far the statistic is from the parameter, standardize the statistic.
Test Statistic
A test statistic measures how far a sample statistic diverges from what we would expect if the null
hypothesis H0 were true, in standardized units. That is,
𝑠𝑡𝑎𝑡𝑖𝑠𝑡𝑖𝑐 − 𝑝𝑎𝑟𝑎𝑚𝑒𝑡𝑒𝑟
𝑡𝑒𝑠𝑡 𝑠𝑡𝑎𝑡𝑖𝑠𝑡𝑖𝑐 =
𝑠𝑡𝑎𝑛𝑑𝑎𝑟𝑑 𝑑𝑒𝑣𝑖𝑎𝑡𝑖𝑜𝑛 𝑜𝑓 𝑠𝑡𝑎𝑡𝑖𝑠𝑡𝑖𝑐
Significance Tests: A Four-Step Process
State: What hypotheses do you want to test, and at what significance level? Define any parameters
you use.
P = clearly state the parameter of interest
H = clearly state the null and alternative hypotheses
Plan: Choose the appropriate method. Check assumptions/conditions.
A = write all assumptions/check conditions
N = name the hypothesis test you will be performing
Do: If the conditions are met, perform the calculations.
T = use the formula to find the test statistic
O = obtain the P-value
Conclude: Interpret the results of your test in the context of the problem.
M = “mantra” conclusion
PHANTOM
When the conditions are met -- Random, Normal, and Independent -- the sampling distribution of 𝑝̂ is
approximately Normal with
𝑝(1−𝑝)
mean 𝜇𝑝̂ = 𝑝 and standard deviation 𝜎𝑝̂ = √ 𝑛
For confidence intervals, we substitute 𝑝̂ for p in the standard deviation formula to obtain the standard
error. When performing significance tests, however, the null hypothesis specifies a value for p, which
we will call p0. When we standardize the statistic 𝑝̂ by substituting its mean and standard deviation we
get the test statistic. This leads to the One-Sample z-Test for a Proportion.
, One-Sample z-Test for a Proportion
Choose an SRS of size n from a large population that contains and unknown proportion p of successes.
To test the hypothesis H0: p = p0, compute the z-statistic:
𝑝̂ − 𝑝0
𝑧=
√𝑝0 (1 − 𝑝0 )
𝑛
Finding the P-value by calculating the probability of getting a z statistic this large or larger in the
direction specified by the alternative hypothesis HA.
Example (One-tailed test) - On shows like American Idol, contestants often wonder if there is an
advantage to performing last. To investigate this, a random sample of 600 AI fans is selected to view the
audition tapes of 12 never-before-seen contestants. For each fan, the order of the 12 videos is
randomly determined. Thus, if the order of performance does not matter, we would expect exactly ½ of
the fans to prefer the last contestant they viewed. Do these data provide convincing evidence that
there is an advantage to going last?


