
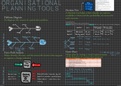
How to construct a decision tree
Organisational
qfqtotot-aqqs.AE
:÷a÷:n÷i÷E0*
1.Draw a key featuring decision and
probability nodes and rejected options.
2.Draw the decision tree.
Maegashira
3.Calculate the expected value of each
option.
Planning tools
4.Calculate the net expected value of each
option.
5.Reject the options with the lowest net
Decision Tree expected value.
A decision tree helps a firm visually see options
available to them and the probability of success for
Fishbone Diagram each outcome
To diagnose the causes of a particular problem
Example Question:
MM is deciding whether to move is entire office to:
cause cause Option A: Bengaluru’s central business district OR Option B: Film City, a film studio site on the outskirts of Bengaluru.
)) I EYE's Fiore I
location cost
i:÷ : :::÷÷:* :: : l :O: ::÷:L :O:
"
cause cause
. s
÷
i÷÷÷÷!
ne-iexm-iea.me
Y:
'
"
II's.fi#asrises
''
'' '
'
¥E Buying "" "
"
,
,
y
""" " " " "
"" " "" " "
¥ F÷%B¥pi* s
:*
union:*
. * .
s¥¥Y÷I%÷?÷%j
f" "" '
°O° +
225000 -
400 ooo =
zzsooo
8001000
80=0%0,0%00.5
,
€ e
,¥y,
"" "
" "" "
Lea , Yo't;
""
usoiooo
use
'
Force Field Analysis Gantt Chart company Im 450000 to
2250.00
Helps identify, discuss, and document the factors that support Helps plan by seeing a visual representation If:O .
sooo
or oppose a change initiative of the duration of a projection (project)
¥4
i¥BEin⑤.eu#a*booosoii .
'
project :
Acquisition of SF ( in months )
EE Driving forces Restraining Forces i 2
3 u
s o a s a co u n
/
§
÷i÷F¥fET÷I F ¥ tFEB5÷ : pay rise)
Reach profit targets Demotivated workers (suspended A
e * * imma Dissatisfied summoners -
reduced dividend .
B
l
I expected recession @ iff#tEBBT" Revenue decrease -
reduced exposure from l l
l
EE MM l "
l
marketing
E / E


