
STAT 200 Week 2 Homework Solutions , STAT 200-University of Maryland University College (UMUC)
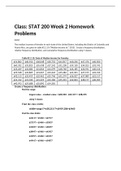
STAT 200 Week 2 Homework Solutions STAT 200 Week 2 Homework Solutions STAT 200 Homework Problems 2.2.2 The median incomes of females in each state of the United States, including the District of Columbia and Puerto Rico, are given in table #2.2.10 ("Median income of," 2013). Create a frequency distribution, relative frequency distribution, and cumulative frequency distribution using 7 classes. Table #2.2.10: Data of Median Income for Females $31,862 $40,550 $36,048 $30,752 $41,817 $40,236 $47,476 $40,500 $60,332 $33,823 $35,438 $37,242 $31,238 $39,150 $34,023 $33,745 $33,269 $32,684 $31,844 $34,599 $48,748 $46,185 $36,931 $40,416 $29,548 $33,865 $31,067 $33,424 $35,484 $41,021 $47,155 $32,316 $42,113 $33,459 $32,462 $35,746 $31,274 $36,027 $37,089 $22,117 $41,412 $31,330 $31,329 $33,184 $35,301 $32,843 $38,177 $40,969 $40,993 $29,688 $35,890 $34,381 2.2.6 Create a histogram and relative frequency histogram for the data in table #2.2.10. Describe the shape and any findings you can from the graph. 2.2.10 Create an ogive for the data in table #2.2.10. Describe any findings you can from the graph. 2.3.4 Table #2.3.7 contains the value of the house and the amount of rental income in a year that the house brings in ("Capital and rental," 2013). Create a scatter plot and state if there is a relationship between the value of the house and the annual rental income. Table #2.3.7: Data of House Value versus Rental Value Rental Value Rental Value Rental Value Rental 2.3.8 The economic crisis of 2008 affected many countries, though some more than others. Some people in Australia have claimed that Australia wasn’t hurt that badly from the crisis. The bank assets (in billions of Australia dollars (AUD)) of the Reserve Bank of Australia (RBA) for the time period of March 2007 through March 2013 are contained in table #2.3.11 ("B1 assets of," 2013). Create a time-series plot and interpret any findings. Table #2.3.11: Data of Date versus RBA Assets Date Assets in billions of AUD Mar-2006 96.9 Jun-2006 107.4 Sep-2006 107.2 Dec-2006 116.2 Mar-2007 123.7 Jun-2007 134.0 Sep-2007 123.0 Dec-2007 93.2 Mar-2008 93.7 Jun-2008 105.6 Sep-2008 101.5 Dec-2008 158.8 Mar-2009 118.7 Jun-2009 111.9 Sep-2009 87.0 Dec-2009 86.1 Mar-2010 83.4 Jun-2010 85.7 Sep-2010 74.8 Dec-2010 76.0 Mar-2011 75.7 Jun-2011 75.9 Sep-2011 75.2 Dec-2011 87.9 Mar-2012 91.0 Jun-2012 90.1 Sep-2012 83.9 Dec-2012 95.8 Mar-2013 90.5 3.1.2 The lengths (in kilometers) of rivers on the South Island of New Zealand that flow to the Pacific Ocean are listed in table #3.1.8 (Lee, 1994). Find the mean, median, and mode. Table #3.1.8: Lengths of Rivers (km) Flowing to Pacific Ocean River Length (km) River Length (km) Clarence 209 Clutha 322 Conway 48 Taieri 288 Waiau 169 Shag 72 Hurunui 138 Kakanui 64 Waipara 64 Rangitata 121 Ashley 97 Ophi 80 Waimakariri 161 Pareora 56 Selwyn 95 Waihao 64 Rakaia 145 Waitaki 209 Ashburton 90 3.1.8 State which type of measurement scale each represents, and then which center measures can be use for the variable? a.) You collect data on the height of plants using a new fertilizer. b.) You collect data on the cars that people drive in Campbelltown, Australia. c.) You collect data on the temperature at different locations in Antarctica. d.) You collect data on the first, second, and third winner in a beer competition. 3.1.12 An employee at Coconino Community College (CCC) is evaluated based on goal setting and accomplishments toward goals, job effectiveness, competencies, CCC core values. Suppose for a specific employee, goal 1 has a weight of 20%, goal 2 has a weight of 20%, goal 3 has a weight of 10%, job effectiveness has a weight of 25%, competency 1 has a goal of 4%, competency 2 has a goal has a weight of 3%, competency 3 has a weight of 3%, competency 4 has a weight of 5%, and core values has a weight of 10%. Suppose the employee has scores of 2.0 for goal 1, 2.0 for goal 2, 4.0 for goal 3, 3.0 for job effectiveness, 2.0 for competency 1, 3.0 for competency 2, 2.0 for competency 3, 3.0 for competency 4, and 4.0 for core values. Find the weighted average score for this employee. If an employee that has a score less than 2.5, they must have a Performance Enhancement Plan written. Does this employee need a plan? 3.2.2 The lengths (in kilometers) of rivers on the South Island of New Zealand that flow to the Pacific Ocean are listed in table #3.2.9 (Lee, 1994). Table #3.2.9: Lengths of Rivers (km) Flowing to Pacific Ocean River Length (km) River Length (km) Clarence 209 Clutha 322 Conway 48 Taieri 288 Waiau 169 Shag 72 Hurunui 138 Kakanui 64 Waipara 64 Waitaki 209 Ashley 97 Waihao 64 Waimakariri 161 Pareora 56 Selwyn 95 Rangitata 121 Rakaia 145 Ophi 80 Ashburton 90 a.) Find the mean and median. b.) Find the range. c.) Find the variance and standard deviation. 3.2.6 Print-O-Matic printing company spends specific amounts on fixed costs every month. The costs of those fixed costs are in table #3.2.13. Table #3.2.13: Fixed Costs for Print-O-Matic Printing Company Monthly charges Monthly cost ($) Bank charges 482 Cleaning 2208 Computer expensive 2471 Lease payments 2656 Postage 2117 Uniforms 2600 a.) Find the mean and median. b.) Find the range. c.) Find the variance and standard deviation.
Document information
- Uploaded on
- April 5, 2021
- Number of pages
- 15
- Written in
- 2020/2021
- Type
- Exam (elaborations)
- Contains
- Questions & answers


