

Preview 2 out of 6 pages
Class notes
Statistics Unit 1 Notes
Preview 2 out of 6 pages
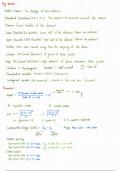
These notes give an overview of introductory statistics, focusing on the methods used to describe and visualize data sets. The notes define key terminology such as measures of center and spread while providing the specific mathematical formulas for calculating mean, standard deviation, and variance. Viarious graphical representations, including histograms, dot plots, and stem-and-leaf displays, to identify patterns like clusters or gaps. Additionally, the text explains how to classify different distributions, such as normal or skewed curves, and how to detect outliers using the interquartile range.
Document information
- Uploaded on
- February 17, 2026
- Number of pages
- 6
- Written in
- 2025/2026
- Type
- Class notes
- Professor(s)
- Jay windley
- Contains
- All classes
$10.39
Wrong document? Swap it for free
Within 14 days of purchase and before downloading, you can choose a different document. You can simply spend the amount again.
Written by students who passed
Immediately available after payment
Read online or as PDF


