

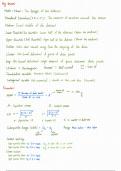
Unit 1 statistics notes
These notes provide a foundational overview of introductory statistics, focusing on the methods used to describe and visualize data sets. The material defines key terminology such as measures of center and spread while providing the specific mathematical formulas for calculating mean, standard deviation, and variance. Visual learners are guided through various graphical representations, including histograms, dot plots, and stem-and-leaf displays, to identify patterns like clusters or gaps. Additionally, the text explains how to classify different distributions, such as normal or skewed curves, and how to detect outliers using the interquartile range. By combining definitions with practical examples, the source establishes a framework for performing a comprehensive data analysis.
Documentinformatie
- Geüpload op
- 15 februari 2026
- Aantal pagina's
- 6
- Geschreven in
- 2025/2026
- Type
- College aantekeningen
- Docent(en)
- Jay windley
- Bevat
- Alle colleges


