

Social Research Methods Final Exam
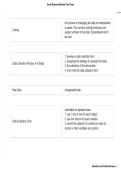
the process of managing the data so interpretation
is easier. The common coding technique is to
Coding
assign numbers to the data. Spreadsheets don't
like text
1. develop a date collection form
2. designate the strategy to represent the data
Data Collection Process in 4 Steps
3. the collection of the actual data
4. entry onto the data collection form
Raw Data unorganized data
chart/table to represent data
1. use 1 line or row for each subject
2. use one column for each variable
Data Collection Form
3. record the subjects' id numbers as rows nd
scores or other variables as columns
Questions and Verified Answers |
, Social Research Methods Final Exam
Good for collecting data where the subject's
resposes are recorded as one of several options
Optical Scoring Sheet
such as a multiple choice test. Use optical scanner
to grade
Use descriptive statistics to describe some of the
characteristics (such as the average scores of one
variable) of the distribution of scores you have
Getting Ready for Data Analysis collected. Inferential statistics are applied to help
you make decisions about how the data you
collected relate to your original hypotheses and
how they might be generalizable.
computing a set of descriptive statistics to allw the
Distribution of Scores researcher to get an accurate first impression of
"what the data look like." for example, histograms.
Three types of average: mean (interval and ratio
Summary Statistics/ Comparing Distributions of
data), median (ordinal data), and mode (nominal
Scores- Measures of Central Tendency
data).
Questions and Verified Answers |
the process of managing the data so interpretation
is easier. The common coding technique is to
Coding
assign numbers to the data. Spreadsheets don't
like text
1. develop a date collection form
2. designate the strategy to represent the data
Data Collection Process in 4 Steps
3. the collection of the actual data
4. entry onto the data collection form
Raw Data unorganized data
chart/table to represent data
1. use 1 line or row for each subject
2. use one column for each variable
Data Collection Form
3. record the subjects' id numbers as rows nd
scores or other variables as columns
Questions and Verified Answers |
, Social Research Methods Final Exam
Good for collecting data where the subject's
resposes are recorded as one of several options
Optical Scoring Sheet
such as a multiple choice test. Use optical scanner
to grade
Use descriptive statistics to describe some of the
characteristics (such as the average scores of one
variable) of the distribution of scores you have
Getting Ready for Data Analysis collected. Inferential statistics are applied to help
you make decisions about how the data you
collected relate to your original hypotheses and
how they might be generalizable.
computing a set of descriptive statistics to allw the
Distribution of Scores researcher to get an accurate first impression of
"what the data look like." for example, histograms.
Three types of average: mean (interval and ratio
Summary Statistics/ Comparing Distributions of
data), median (ordinal data), and mode (nominal
Scores- Measures of Central Tendency
data).
Questions and Verified Answers |


