ECON 104 HOMEWORK 3 QUESTION AND ANSWERS
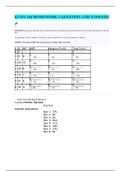
ECON 104 HOMEWORK 3 QUESTION AND ANSWERSFill in Table B - Each box is worth ½ point for a total of 9 points for Table B Use Scenario B/Table B to answer the questions 2 – 4 below. (3 points) The profit maximizing output (Q) is The profit maximizing level of labor (L) input is The maximum profit for this firm is DOWNLOAD AND PRINT GRAPHING TEMPLATE (available in the homework 3 instructions). This template already shows the outcome from scenario A. You will be adding results from scenario B to these graphs. (2 points) Using Scenario B/Table B, go to Graph 1. Label the new profit maximizing Q and L combination on the production function as point B. Using Scenario B/Table B, go to Graph 2 and draw this firm’s new MRP curve (remember that MRP = P* MPL, and since price changed, we know we have a new MRP curve!). Shade in the new area of profit. Also label the new profit maximizing point as letter B. Using Scenario B/Table B, draw this firm’s Supply curve on Graph 3. You should construct a supply curve as we did in lecture with point A representing the original price and output combination from scenario A (original price was $20 combined with the profit maximizing Q of 28) and point B representing the price and output combination after the change in economic conditions in Scenario B (price rose to $22, and the profit maximizing Q you found in your answer for #2 above). Connect the two points and label your supply curve. When comparing Scenario A to Scenario B, the firm now hires _______ workers. When comparing Scenario A to Scenario B, the firm now produces _____ output. When comparing Scenario A to Scenario B, the firm now earns _______ profit. SCENARIO C - We return to the original conditions (from scenario A) and now we let wages change. In particular, an increase in labor supply lowers the wage that the firm needs to pay to $130. For question 11. Fill in Table C - Each box is worth ½ point for a total of 6 points for Table C TABLE C- The wage has changed to $130 but the price of output (Q) is back at its original value of $20. Use Scenario C/Table C to answer the questions 12 – 14 below. (3 points) The profit maximizing output is The profit maximizing level of labor input is The maximum profit for this firm is Using Scenario C/Table C, go to Graph 1. Label the profit maximizing Q and L combination as point C Using Scenario C/Table C, go to Graph 4 and draw in this firm’s new wage line. The MRP curve is unchanged since MRP = P* MPL, and neither P nor MPL has changed. Shade in the new area for profit. Also label the profit maximizing point as letter C. Using Scenario C/Table C, go to graph 3 and add this firm’s new supply curve (remember that wages fell, so output supply increases). Label as point C the price and output combination occurring after the change in economic conditions in Scenario C (P= $20, and the profit maximizing Q you found in your answer for #12 above). You only have one point on this supply curve, but you can sketch it as an upward sloping supply curve that is parallel to the supply curve you drew earlier. When comparing Scenario A to Scenario C, the firm now hires _______ When comparing Scenario A to Scenario C, the firm now produces _____ When comparing Scenario A to Scenario C, the firm now earns _______ profit. SCENARIO D - In this final scenario, we again return to our original conditions (from scenario A) and consider a positive productivity shock, just like we did in the lectures. In particular, let the MPL of each worker rise by two, due to an increase in total factor productivity (denoted A in the lecture), relative to the initial conditions. For question 21, fill in Table D. Each box is worth ½ point for a total of 15 points for Table D Use Scenario D/Table D to answer the questions 22 – 24 below. (3 points) The profit maximizing output is The profit maximizing level of labor input is The maximum profit for this firm is Using Scenario D/Table D, go to Graph 1. Draw your new production function (remember technology [total factor productivity] increased, shifting the production function!) Label the new profit maximizing Q and L combination as point D. Using Scenario D/Table D, go to Graph 5 and draw this firm’s new MRP curve (remember that MRP = P* MPL, and since MPL has changed, we know we have a new MRP curve!). Shade in the new area of profit. Also label the new profit maximizing point as letter D. Using Scenario D/Table D, go to Graph 3 and add this firm’s new supply curve (a positive productivity shock increases supply!). Label the price and output combination after the change in economic conditions in Scenario D (P= $20, and the profit maximizing Q you found in your answer for #22 above). You only have one point on this supply curve, but you can sketch it as an upward sloping supply curve that is parallel to the supply curves you drew earlier. When comparing Scenario A to Scenario D, the firm now hires _______ workers. When comparing Scenario A to Scenario D, the firm now produces _____ output. When comparing Scenario A to Scenario D, the firm now earns _______ profit.
Written for
Document information
- Uploaded on
- March 12, 2021
- Number of pages
- 16
- Written in
- 2020/2021
- Type
- Exam (elaborations)
- Contains
- Questions & answers
Subjects
-
fill in table b each box is worth ½ point for a total of 9 points for table b use scenario btable b to answer the questions 2 – 4 below 3 points the profit maximizing output q is the profit ma
Also available in package deal