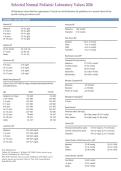
Selected Normal Pediatric Laboratory Values 2026
All laboratory values listed are approximate. Consult your local laboratory for guidelines as to normal values for the
specific testing procedures used.
NORMAL VALUES: BLOOD
Albumin (S)1 Ammonia (P)1
Newborn: 2.6–3.6 g/dL Newborns: ,50 mmol/L
1–3 years: 3.4–4.2 g/dL Thereafter: 0–35 mmol/L
4–6 years: 3.5–5.2 g/dL
7–9 years: 3.7–5.6 g/dL
10–19 years: 3.7–5.6 g/dL Base Excess (B)1
Newborn: –10 to –2 mmol/L
Aldolase (S)1 Infant: –7 to –1 mmol/L
Child: –4 to +2 mmol/L
10–24 months: 3.4–11.8 U/L Thereafter: –3 to +3 mmol/L
2–7 years: 1.2–8.8 U/L
Adults: 1.7–4.9 U/L
Bicarbonate, Actual (P)2
Aldosterone (S)1 Calculated from pH and PaCO2
Newborns: 17.2–23.6 mmol/L
6–9 years: 1–24 ng/dL
2 months–2 years: 19–24 mmol/L
10–11 years: 2–15 ng/dL
Children: 18–25 mmol/L
12–14 years: 1–22 ng/dL
Adult males: 20.1–28.9 mmol/L
15–17 years: 1–32 ng/dL
Adult females: 18.4–28.8 mmol/L
Alkaline Phosphatase (S)2
Bilirubin, Conjugated (S)1
Values in IU/L at 37°C (98.6°F) using p-nitrophenol phosphate buffered
with AMP (kinetic). Neonates: ,10 mmol/L
Neonate: ,2 mmol/L
Preterm (1–6 days): ,10 mmol/L
Age Males Females
Newborns (1–3 days) 95–368 95–368 Bleeding Time (Simplate)2
2–24 months 115–460 115–460
2–5 years 115–391 115–391 2–9 min.
6–7 years 115–460 115–460
8–9 years 115–345 115–345 Blood Volume2
10–11 years 115–336 115–437
12–13 years 127–403 92–336 Premature infants: 98 mL/kg
14–15 years 79–446 78–212 At 1 year: 86 mL/kg (range, 69–112 mL/kg)
16–18 years 58–331 35–124 Older children: 70 mL/kg (range, 51–86 mL/kg)
Adults 41–137 39–118
Calcium (S)2
a1Antitrysin (S)1
Premature infants (first week): 3.5–4.5 mEq/L (1.7–2.3 mmol/L)
Newborn: 143– 440 mg/dL Full-term infants (first week): 4.0–5.0 mEq/L (2.0–2.5 mmol/L)
1–3 years: 147–244 mg/dL Thereafter: 4.4–5.3 mEq/L (2.2–2.7 mmol/L)
4–9 years: 160–245 mg/dL
10–13 years: 166–267 mg/dL
Carbon Dioxide, Partial Pressure (PCO2) (B)1
14–19 years: 152–317 mg/dL
Newborn: 27–40 mmHg (3.6–5.5 kPa)
Infant: 27–41 mmHg (3.6–5.5 kPa)
Note: Modified from: Children: 32–48 mmHg (4.3–6.4 kPa)
1Soldin, S.J., Brugnara, C., & Hicks, J.M. (1999). Pediatric reference ranges
(3rd ed.). Washington, DC: AACC Press.
2Hay, W.W., Hayward, A.R., Levin, M.J., Sondheimer, J.M. (2000). Current Carbon Dioxide, Total (P)1
pediatric diagnosis and treatment (15th ed.). New York: Lange Medical
Books/McGraw Hill. Cord blood: 13–29 mmol/L
,1 year: 17–31 mmol/L
Adults: 24–30 mmol/L
, Chloride (S, P)1 Fasting Insulin Level3
,1 year: 96–111 mmol/L 1.8–24.6 mU/L
1–17 years: 102–112 mmol/L
Adults: 100–108 mmol/L Fibrinogen (P)2
200–500 mg/dL (5.9–14.7 mmol/L)
Cholesterol, High-Density Lipoprotein (S)1
1–9 years: 35–82 mg/dL (0.91–2.12 mmol/L) Galactose (S, P)2
10–13 years: 36–84 mg/dL (0.93–2.17 mmol/L)
14–19 years: 35–65 mg/dL (0.91–1.68 mmol/L) 1.1–2.1 mg/dL (0.06–0.12 mmol/L)
Cholesterol, Low-Density Lipoprotein (S)1 Galactose 1-Phosphate (RBC)
5–9 years: 63–140 mg/dL (1.63–3.63 mmol/L) Normal: 1 mg/dL of packed erythrocyte lysate; slightly higher in cord blood
10–14 years: 64–136 mg/dL (1.66–3.52 mmol/L) Infants with congenital galactosemia on a milk-free diet: ,2 mg/dL
15–19 years: 59–137 mg/dL (1.53–3.55 mmol/L) Infants with congenital galactosemia taking milk: 9–20 mg/dL
Cholesterol, Total (S, P)1 Galactose 1-Phosphate Uridyl Transferase (RBC)2
1–3 years: 44–181 mg/dL (1.15–4.70 mmol/L) Normal: 308–475 mIU/g of hemoglobin
4–6 years: 108–187 mg/dL (2.80–4.80 mmol/L) Heterozygous for Duarte variant: 225–308 mIU/g of hemoglobin
7–9 years: 112–247 mg/dL (2.90–6.40 mmol/L)
Homozygous for Duarte variant: 142–225 mIU/g of hemoglobin
10–13 years: 125–244 mg/dL (3.25–6.30 mmol/L)
Heterozygous for congenital galactosemia: 142–225 mIU/g of hemoglobin
14–19 years: 106–224 mg/dL (2.75–5.80 mmol/L)
Homozygous for congenital galactosemia: ,8 mIU/g of hemoglobin
Complement (S)2
Glucose (S, P)2
C3: 96–195 mg/dL
Premature infants: 20–80 mg/dL (1.11–4.44 mmol/L)
C4: 15–20 mg/dL
Full-term infants: 30–100 mg/dL (1.67–5.56 mmol/L)
Children and adults (fasting): 60–105 mg/dL (3.33–5.88 mmol/L)
Creatine Kinase (S, P)2
Newborns (1–3 days): 40–474 IU/L at 37°C (98.6°F) Glucose 6-Phosphate Dehydrogenase (RBC)2
Adult males: 30–210 IU/L at 37°C (98°F)
150–215 units/dL
Adult females: 20–128 IU/L at 37°C (98.6°F)
Glucose Tolerance Test Results in Serum a2
Creatine (S, P)2
Values in mg/dL (mmol/L) GLUCOSE INSULIN
Age Males Females TIME mg/dL mmol/L mU/mL pmol/L
1–3 daysa 0.2–1.0 (17.7–88.4) 0.2–1.0 (17.7–88.4) Fasting 59–96 3.11–5.33 5–40 36–287
1 year 0.2–0.6 (17.7–53.0) 0.2–0.5 (17.7–44.2) 30 min 91–185 5.05–10.27 36–110 258–789
2–3 years 0.2–0.7 (17.7–61.9) 0.3–0.6 (26.5–53.0) 60 min 66–164 3.66–9.10 22–124 158–890
4–7 years 0.2–0.8 (17.7–70.7) 0.2–0.7 (17.7–61.9) 90 min 68–148 3.77–8.22 17–105 122–753
8–10 years 0.3–0.9 (26.5–79.6) 0.3–0.8 (26.5–70.7)
2 hr 66–122 3.66–6.77 6–84 43–603
11–12 years 0.3–1.0 (26.5–88.4) 0.3–0.9 (26.5–79.6)
3 hr 47–99 2.61–5.49 2–46 14–330
13–17 years 0.3–1.2 (26.5–106.1) 0.3–1.1 (26.5–97.2)
4 hr 61–93 3.39–5.16 3–32 21–230
18–20 years 0.5–1.3 (44.2–115.0) 0.3–1.1 (26.5–97.2)
5 hr 63–86 3.50–4.77 5–37 36–265
a Values may be higher in premature newborns.
aNormal levels based on results in 13 normal children given glucose,
1.75 g/kg orally in one dose, after 2 weeks on a high-carbohydrate diet.
Creatinine Clearance2
Values show great variability and depend on specificity of analytical Glycosylated Hemoglobin (Hemoglobin A1) (B)1
methods used.
Newborns (1 day): 5–50 mL/min/1.73 m2 Normal: 4–7% of total hemoglobin
(mean, 18 mL/min/1.73 m2) Diabetic patients in good control 8–10%
Newborns (6 days): 15–90 mL/min/1.73 m2 of their condition:
(mean, 36 mL/min/1.73 m2) Diabetic patients in poor control: 8–18%
Adult males: 85–125 mL/min/1.73 m2 Pregnant Women: 5%–8%
Adult females: 75–115 mL/min/1.73 m2 Values tend to vary with testing technique.
aNote: These values reflect total Hemoglobin A1 levels. When Hemoglobin
C-Reactive Protien (S)1
A1c is computed, values are usually 2–4% lower.
Cord blood: 10–350 mg/L
Adult: 68–8,200 mg/L

