Beliebte Kurse 'NAHQ Practice CPHQ' bei NAHQ Practice CPHQ
NAHQ Practice CPHQ Studienführer, Klassennotizen & Zusammenfassungen
Suchst du nach den besten Studienführern, Studiennotizen und Zusammenfassungen über NAHQ Practice CPHQ? Auf dieser Seite findest du 33 Studienunterlagen zu NAHQ Practice CPHQ.
All 33 Ergebnisse
Sortieren nach
-
NAHQ Practice CPHQ Questions EXAM QUESTIONS &ANSWERS GRADED A+
- Prüfung • 37 Seiten • 2024
-
- 12,47 €
- + erfahre mehr
2011 MOQ 1- In evaluating "long waiting times," a healthcare quality professional best demonstrates components related to staffing, methods, measures, materials, and equipment utilizing A. a run chart. B. a histogram. C. a pie chart. D. an Ishikawa diagram. EXPLANATIONS: A. Run charts are used to track data over time. B. Histograms and bar charts are used to show distribution. C. Pie charts are used to compare parts of a whole. D. An Ishikawa (cause and effect) diagram helps to...
-
NAHQ Practice CPHQ Questions Complete with Answers Verified and Graded 2024 Update
- Prüfung • 37 Seiten • 2024
-
- 12,95 €
- + erfahre mehr
2011 MOQ 1- In evaluating "long waiting times," a healthcare quality professional best demonstrates components related to staffing, methods, measures, materials, and equipment utilizing A. a run chart. B. a histogram. C. a pie chart. D. an Ishikawa diagram. EXPLANATIONS: A. Run charts are used to track data over time. B. Histograms and bar charts are used to show distribution. C. Pie charts are used to compare parts of a whole. D. An Ishikawa (cause and effect) diagram helps to...
-
NAHQ practice CPHQ questions with all the correct answers(Latest updated questions and answers)
- Prüfung • 37 Seiten • 2024
-
- 10,55 €
- + erfahre mehr
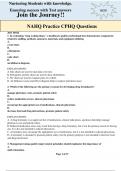
1- In evaluating "long waiting times," a healthcare quality professional best demonstrates components related to staffing, methods, measures, materials, and equipment utilizing A. a run chart. B. a histogram. C. a pie chart. D. an Ishikawa diagram. EXPLANATIONS: A. Run charts are used to track data over time. B. Histograms and bar charts are used to show distribution. C. Pie charts are used to compare parts of a whole. D. An Ishikawa (cause and effect) diagram helps to analyze po...
-
NAHQ practice CPHQ questions with all the correct answers(Latest updated questions and answers)
- Prüfung • 37 Seiten • 2024
-
- 10,55 €
- + erfahre mehr
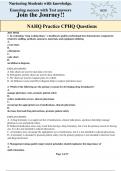
1- In evaluating "long waiting times," a healthcare quality professional best demonstrates components related to staffing, methods, measures, materials, and equipment utilizing A. a run chart. B. a histogram. C. a pie chart. D. an Ishikawa diagram. EXPLANATIONS: A. Run charts are used to track data over time. B. Histograms and bar charts are used to show distribution. C. Pie charts are used to compare parts of a whole. D. An Ishikawa (cause and effect) diagram helps to analyze po...
-
NAHQ practice CPHQ questions with all the correct answers(Latest updated questions and answers)
- Prüfung • 37 Seiten • 2024
-
- 10,55 €
- + erfahre mehr
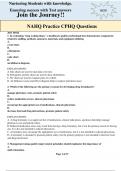
1- In evaluating "long waiting times," a healthcare quality professional best demonstrates components related to staffing, methods, measures, materials, and equipment utilizing A. a run chart. B. a histogram. C. a pie chart. D. an Ishikawa diagram. EXPLANATIONS: A. Run charts are used to track data over time. B. Histograms and bar charts are used to show distribution. C. Pie charts are used to compare parts of a whole. D. An Ishikawa (cause and effect) diagram helps to analyze po...
-
NAHQ practice CPHQ questions with all the correct answers(Latest updated questions and answers)
- Prüfung • 37 Seiten • 2024
-
- 10,55 €
- + erfahre mehr
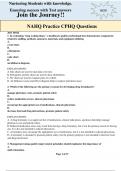
1- In evaluating "long waiting times," a healthcare quality professional best demonstrates components related to staffing, methods, measures, materials, and equipment utilizing A. a run chart. B. a histogram. C. a pie chart. D. an Ishikawa diagram. EXPLANATIONS: A. Run charts are used to track data over time. B. Histograms and bar charts are used to show distribution. C. Pie charts are used to compare parts of a whole. D. An Ishikawa (cause and effect) diagram helps to analyze po...
-
NAHQ practice CPHQ questions with all the correct answers(Latest updated questions and answers)
- Prüfung • 37 Seiten • 2024
-
- 10,55 €
- + erfahre mehr
1- In evaluating "long waiting times," a healthcare quality professional best demonstrates components related to staffing, methods, measures, materials, and equipment utilizing A. a run chart. B. a histogram. C. a pie chart. D. an Ishikawa diagram. EXPLANATIONS: A. Run charts are used to track data over time. B. Histograms and bar charts are used to show distribution. C. Pie charts are used to compare parts of a whole. D. An Ishikawa (cause and effect) diagram helps to analyze po...
-
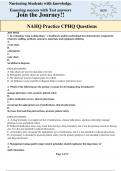
NAHQ Practice CPHQ Questions with all the correct answers(Latest updated questions and answers)
- Prüfung • 37 Seiten • 2024
-
- 16,79 €
- + erfahre mehr
2011 MOQ 1- In evaluating "long waiting times," a healthcare quality professional best demonstrates components related to staffing, methods, measures, materials, and equipment utilizing A. a run chart. B. a histogram. C. a pie chart. D. an Ishikawa diagram. EXPLANATIONS: A. Run charts are used to track data over time. B. Histograms and bar charts are used to show distribution. C. Pie charts are used to compare parts of a whole. D. An Ishikawa (cause and effect) diagram helps to...
-
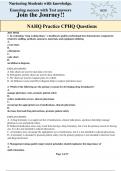
NAHQ Practice CPHQ Latest Questions and Answers with Explanations, All Correct Study Guide, Download to Score A
- Prüfung • 37 Seiten • 2024
-
- 16,79 €
- + erfahre mehr
NAHQ Practice CPHQ Questions 2011 MOQ 1- In evaluating "long waiting times," a healthcare quality professional best demonstrates components related to staffing, methods, measures, materials, and equipment utilizing A. a run chart. B. a histogram. C. a pie chart. D. an Ishikawa diagram. EXPLANATIONS: A. Run charts are used to track data over time. B. Histograms and bar charts are used to show distribution. C. Pie charts are used to compare parts of a whole. D. An Ishikawa (caus...
CPHQ Bundled Exams with Complete Solution | Verified | Guaranteed Success

Wie hat er das geschafft? Indem er seine Studienmaterialien auf Stuvia verkaufte. Probier es selbst! Entdecke alles über Verdienstmöglichkeiten auf Stuvia


