Datascience24
Please message me using Send Message option for new assignment requests.
- 190
- 0
- 10
Community
- Volgers
- Volgend
12 Ontvangen beoordelingen
200 items
Building a Hadoop Cluster with three VMs
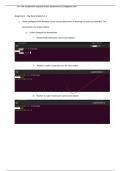
Building a Hadoop Cluster with three VMs Assignments 1. (55pts in total) Check whether your Hadoop cluster is running correctly or not. Explain and take screenshots. a. (15pts) Before you do it, change or show the hostnames of your three nodes. i. Hostnames 1. Master: <your-NetID>-HM 2. Worker1: <your-NetID>-W1 3. Worker2: <your-NetID>-W2 4. For example, sslee777-HM, sslee777-W1, and sslee777-W2 ii. b. (15pts) By creating your user directory See the below example (...
- Tentamen (uitwerkingen)
- • 6 pagina's •
Building a Hadoop Cluster with three VMs Assignments 1. (55pts in total) Check whether your Hadoop cluster is running correctly or not. Explain and take screenshots. a. (15pts) Before you do it, change or show the hostnames of your three nodes. i. Hostnames 1. Master: <your-NetID>-HM 2. Worker1: <your-NetID>-W1 3. Worker2: <your-NetID>-W2 4. For example, sslee777-HM, sslee777-W1, and sslee777-W2 ii. b. (15pts) By creating your user directory See the below example (...
Big_Data_Analytics_Ex2-1
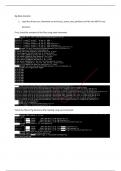
Write Pig scripts for finding truck drivers exceeded the speed limit, ‘overspeed’. a. Dataset: Truck IoT dataset i. Dataset location (Linux filesystem): /home/data/CSC534BDA/datasets/Truck-IoT/ ii. Filenames: truck_event_text_ b. Write and run your Pig scripts i. (20pts) Find all truck drivers who exceeded the speed limit, ‘Overspeed’ ii. (10pts) Define schema when you load the data (Don’t use $0, $1, or etc.) iii. (10pts) Show the driver’s events grouped, if the drivers exc...
- Tentamen (uitwerkingen)
- • 3 pagina's •
Write Pig scripts for finding truck drivers exceeded the speed limit, ‘overspeed’. a. Dataset: Truck IoT dataset i. Dataset location (Linux filesystem): /home/data/CSC534BDA/datasets/Truck-IoT/ ii. Filenames: truck_event_text_ b. Write and run your Pig scripts i. (20pts) Find all truck drivers who exceeded the speed limit, ‘Overspeed’ ii. (10pts) Define schema when you load the data (Don’t use $0, $1, or etc.) iii. (10pts) Show the driver’s events grouped, if the drivers exc...
Spreadsheets_for_Business_Analytics_Week15_ExcelSolver
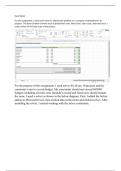
Solver Using your own problem find an optimization solution. Maybe you want to maximize the profit of your sewing operation that makes pants and shirts. Maybe you want to find the optimum balance of stocks in your portfolio. Or, maybe you want to come up with your own example. Submit a Word document with your explanation, in 500 words or more, of how you used Solver to answer your business question. Include screenshots of your work (with the desktop slice, of course). Note: This document is...
- Tentamen (uitwerkingen)
- • 2 pagina's •
Solver Using your own problem find an optimization solution. Maybe you want to maximize the profit of your sewing operation that makes pants and shirts. Maybe you want to find the optimum balance of stocks in your portfolio. Or, maybe you want to come up with your own example. Submit a Word document with your explanation, in 500 words or more, of how you used Solver to answer your business question. Include screenshots of your work (with the desktop slice, of course). Note: This document is...

Spreadsheets_for_Business_Analytics_Week14_LinearRegression
Linear Regression Open the attached .csv file. Select Regression from the data analysis tab Weight will be our predictor variable and MPG the response variable. Select your x (predictor) and y (response) ranges accordingly. Check the labels button and and output cell. Observe the ANOVA matrix. The F-statistic will tell you whether your model is better than simply using the mean. You will want the F-statistic to be as high as possible and the significance to be as low as possible. The equati...
- Tentamen (uitwerkingen)
- • 2 pagina's •
Linear Regression Open the attached .csv file. Select Regression from the data analysis tab Weight will be our predictor variable and MPG the response variable. Select your x (predictor) and y (response) ranges accordingly. Check the labels button and and output cell. Observe the ANOVA matrix. The F-statistic will tell you whether your model is better than simply using the mean. You will want the F-statistic to be as high as possible and the significance to be as low as possible. The equati...

Spreadsheets_for_Business_Analytics_Week13_RFMAnalysis
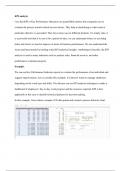
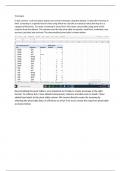
According to , RFM analysis is a marketing technique used to quantitatively rank and group customers based on the recency, frequency and monetary total of their recent transactions to identify the best customers and perform targeted marketing campaigns. Using your own dataset, execute an RFM analysis and explain your analysis and your findings in 500 words or more. Note: This document is for learning purposes only.
- Tentamen (uitwerkingen)
- • 3 pagina's •
According to , RFM analysis is a marketing technique used to quantitatively rank and group customers based on the recency, frequency and monetary total of their recent transactions to identify the best customers and perform targeted marketing campaigns. Using your own dataset, execute an RFM analysis and explain your analysis and your findings in 500 words or more. Note: This document is for learning purposes only.
Spreadsheets_for_Business_Analytics_Week12_KPIAnalysis
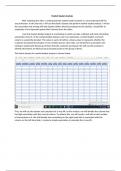
KPI analysis using process behavior/control charts and this video with an example business process behavior chart. Note that Langer uses a natural end to the time series (end of year) to allow him to create two process charts which can be compared, as well. Read the attached document showing how to create and analyze the process control chart. Using your own choice of dataset and what you have learned from the video use a KPI analysis to learn about your data set. Discuss in 500 words or more, w...
- Tentamen (uitwerkingen)
- • 3 pagina's •
KPI analysis using process behavior/control charts and this video with an example business process behavior chart. Note that Langer uses a natural end to the time series (end of year) to allow him to create two process charts which can be compared, as well. Read the attached document showing how to create and analyze the process control chart. Using your own choice of dataset and what you have learned from the video use a KPI analysis to learn about your data set. Discuss in 500 words or more, w...
Spreadsheets for Business ASpreadsheets_for_Business_Analytics_Week11_MarketBasketAnalysisnalytics
Market Basket Analysis. Using what you have learned use Market Basket Analysis to mine association rules from your own data set. Discuss in 500 words or more, what patterns in association rules reveal about your business question. Share the business question you are attempting to answer. Submit a Word document with screenshots of your Market Basket Analysis including your use of the Solver and your discussion. Always include a slice of your desktop with any screenshot. Note: This document i...
- Tentamen (uitwerkingen)
- • 3 pagina's •
Market Basket Analysis. Using what you have learned use Market Basket Analysis to mine association rules from your own data set. Discuss in 500 words or more, what patterns in association rules reveal about your business question. Share the business question you are attempting to answer. Submit a Word document with screenshots of your Market Basket Analysis including your use of the Solver and your discussion. Always include a slice of your desktop with any screenshot. Note: This document i...
Spreadsheets_for_Business_Analytics_Week10_Treemaps
Treemaps Using what you have learned create treemaps visualizing data from your data set. Discuss, in 500 words or more, what the treemaps reveal about your business question. Share the business question you are attempting to answer. Submit a Word document with screenshots of your treemaps and your discussion. Always include a slice of your desktop with any screenshot, Please note that all code assignments must be submitted as a screenshot with a slice of your desktop showing the timestamp....
- Tentamen (uitwerkingen)
- • 3 pagina's •
Treemaps Using what you have learned create treemaps visualizing data from your data set. Discuss, in 500 words or more, what the treemaps reveal about your business question. Share the business question you are attempting to answer. Submit a Word document with screenshots of your treemaps and your discussion. Always include a slice of your desktop with any screenshot, Please note that all code assignments must be submitted as a screenshot with a slice of your desktop showing the timestamp....
Web_Analytics_Week14_Navigation_and_Advertisement_Reports
Navigation and Advertisement Reports Two of the newest features of GA 4.0 includes navigation and advertisement reports. After reading through the chapter, test out these two reports. Provide 3 screenshots per report (6 total). Below each screenshot, provide a 1-2 paragraph summary on what the image/report is highlighting. In addition, provide a sentence on how this is beneficial to web analysts. Note: This document is for learning purposes only.
- Boek
- Tentamen (uitwerkingen)
- • 9 pagina's •
Navigation and Advertisement Reports Two of the newest features of GA 4.0 includes navigation and advertisement reports. After reading through the chapter, test out these two reports. Provide 3 screenshots per report (6 total). Below each screenshot, provide a 1-2 paragraph summary on what the image/report is highlighting. In addition, provide a sentence on how this is beneficial to web analysts. Note: This document is for learning purposes only.
Web_Analytics_Week10_Creating_a_dashboard
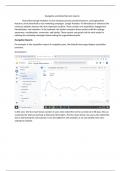
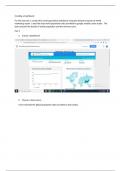
Creating a dashboard Part I: Log into the Google Analytics Demo Account () Create a dashboard. Choose a data source. Customize the report to bring forward the most relevant results. Take a screenshot for each question and provide a brief explanation of your experience completing the question. Part II: Log into the Answer the following questions by taking a screenshot and explaining what is being represented. Identify the terms driving the most organic traffic. Identify the terms lead...
- Boek
- Tentamen (uitwerkingen)
- • 5 pagina's •
Creating a dashboard Part I: Log into the Google Analytics Demo Account () Create a dashboard. Choose a data source. Customize the report to bring forward the most relevant results. Take a screenshot for each question and provide a brief explanation of your experience completing the question. Part II: Log into the Answer the following questions by taking a screenshot and explaining what is being represented. Identify the terms driving the most organic traffic. Identify the terms lead...
Santander_Bank_Case_Study_ML_Week6_NEC
Drawing_Maps_VisualAnalytics_Week13_NEC_Solved
MNIST _Fashion_MNIST_image_data_ML_Wk12_NEC_Solved
Santander_Bank_Case_Study_ML_Week6_NEC
Fundamentals_of_ensemble_modeling_Week5_NEC