Histogram Study guides, Class notes & Summaries
Looking for the best study guides, study notes and summaries about Histogram? On this page you'll find 2897 study documents about Histogram.
Page 4 out of 2.897 results
Sort by
-
Straighterline Introduction to Statistics questions with complete solutions 2023
- Exam (elaborations) • 5 pages • 2023
- $10.99
- 2x sold
- + learn more
Straighterline Introduction to Statistics questions with complete solutions 2023Four steps in the process of statistics 1. Producing Data 2. Exploratory Data Analysis 3. Probability 4. Inference Categorical variable places individuals into one of several groups Two types: nominal and ordinal Quantitative Variable represents a measurement or a count Two types: Interval and ratio Nominal Variable categorical variables where there is no natural order among the categori...
-
Statistics 100 Final Review Questions With Complete Solutions
- Exam (elaborations) • 23 pages • 2023
- $10.99
- + learn more
Statistics 100 Final Review Questions With Complete Solutions We record the zip codes of newly admitted students. How should we treat this data? correct answer: As categorical data We record the wavelengths of light reflecting off of several bird-of-paradise feathers. How should we treat this data? correct answer: as numeric data We record the genus of every tree identified along a transect. How should we treat this data? correct answer: as categorical data The height of bars in a h...
-
BSTAT 2305 FINAL Q&A
- Exam (elaborations) • 26 pages • 2023
- $14.99
- + learn more
The following histogram represents the number of pages in each book within a collection. What is the frequency of books containing at least 250 but fewer than 400 pages? - Answer- 11 Add the frequencies, 7, 3, and 1, for the classes 250 up to 300, 300 up to 350, and 350 up to 400. The accompanying relative frequency distribution represents the last year car sales for the sales force at Kelly's Mega Used Car Center. Car Sales - Relative Frequency 35 up to 45 - 0.07 45 up to ...
-
RD EXAM PREP COMPREHENSIVE 2023 with 100% c0rrect answers
- Exam (elaborations) • 16 pages • 2023
- $15.49
- 1x sold
- + learn more
child has a starved appearance and a distended belly. what type of malnutrition does the child likely have? a. kwashiorkor b. cachexia mus a a school RD collected BMIs of middle school students over the last year. what is the best way for the RD to interpret and share her data? AND WHY a. histogram b. pie chart c. bar chart d. line graph a-histograms summarize data from a process that has been collected over time (pie chart would work best to show % of each student in each BM...
-
EPI 522 Midterm Quiz Summary- Rush University 2023/24
- Exam (elaborations) • 20 pages • 2023
- $18.99
- + learn more
EPI 522 Midterm Quiz Summary- Rush University 2023/24 Height recorded in centimeters should be displayed using SELECT ALL THAT APPLY Bar chart. Box-and-whisker plot. Stem-and-leaf plot. Histogram. Question 2 The dependent variable is The intervention being studied. The experiemental variable. The variable manipulated by the researcher. The outcome variable. Question 3 A student is planning on conducting a quality improvement project on a unit in the university hospital where the s...

As you read this, a fellow student has made another $4.70

-
TEST BANK FOR TIETZ FUNDAMENTALS OF CLINICAL CHEMISTRY AND MOLECULAR DIAGNOSTICS 7TH EDITION BY BURTIS
- Exam (elaborations) • 67 pages • 2023
- $16.49
- 1x sold
- + learn more
TEST BANK FOR TIETZ FUNDAMENTALS OF CLINICAL CHEMISTRY AND MOLECULAR DIAGNOSTICS 7TH EDITION BY BURTIS Table of Contents PREFACE ............................................................................................................................................... 2 Chapter 01: Clinical Chemistry, Molecular Diagnostics, and Laboratory Medicine ...................... 2 Chapter 02: Selection and Analytical Evaluation of Methods With Statistical Techniques .......... 5 Chapter 03: Clinical...
-
Test_Bank_Radiographic_Image_Analysis_5th_Edition_Martensen
- Exam (elaborations) • 12 pages • 2023
- $8.99
- + learn more
Chapter 02: Visibility of Details Martensen: Radiographic Image Analysis, 5th Edition MULTIPLE CHOICE 1. The light collected and converted to an electrical signal by the photomultiplier tube (PMT) during CR image sampling is then sent to the to be digitized. a. ADC (analog-to-digital converter) b. DAC (digital-to-analog converter) c. LUT (lookup table) d. workstation 2. What is the location on a histogram graph of air/gas? a. Center b. Far right c. Left d. Right 3. What i...
-
SASB Level II Questions with Correct Answers 100% Verified 2024/2025
- Exam (elaborations) • 11 pages • 2024
- $9.99
- + learn more
SASB Level II Questions with Correct Answers 100% Verified 2024/2025 Recognizing Data Types Question - Correct Answers 1. Does the Metric yield Discrete Data? 2.Does the metric yield Continuous Data? 3.What is the possible range of performance on a topic? Discrete Data - Correct Answers Data that can only take certain values. IE Number of Requests or Number of data breaches. continous data - Correct Answers Numerical data that is not discrete. Can include fractions, infinitely divisible...
-
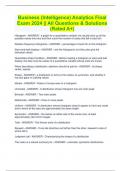
Business (Intelligence) Analytics Final Exam 2024 || All Questions & Solutions (Rated A+)
- Exam (elaborations) • 19 pages • 2024
- $11.49
- + learn more
Business (Intelligence) Analytics Final Exam 2024 || All Questions & Solutions (Rated A+) Business (Intelligence) Analytics Final Exam 2024 || All Questions & Solutions (Rated A+) Histogram - ANSWER - a graph for a quantitative variable; we usually slice up all the possible values into bins and then count the number of cases that fall in each bin Relative frequency histograms - ANSWER - percentages of each bin in the histogram Stem-and-leaf displays - ANSWER - are like histograms, but ...
-
BIO 182 Create a plot of a frequency distribution (also known as a histogram) of the conce
- Summary • 3 pages • 2024
- $7.99
- + learn more
BIO 182 Create a plot of a frequency distribution (also known as a histogram) of the conce BIO 182 Create a plot of a frequency distribution (also known as a histogram) of the concentration of cadmium in water (sample size = 20 water samples). Your plot should follow the formatting guidelines listed below. Save your plot as an JPG, PDF, or .xls/.xlsx. Click œChoose a file and upload your frequency distribution. Formatting Instructions ï‚·Chart type: Columnï‚·Y-axes title: œFrequen...
