Ap statistics Study guides, Class notes & Summaries
Looking for the best study guides, study notes and summaries about Ap statistics? On this page you'll find 551 study documents about Ap statistics.
Page 3 out of 551 results
Sort by
-
AP Statistics Final Exam Study Questions 2024.
- Exam (elaborations) • 24 pages • 2024
- $12.99
- + learn more
AP Statistics Final Exam Study Questions 2024. What is a dot plot? - correct answer A graphical display which shows "dots" for each point. It's good for categorical data- ie data classified into categories. What's the difference between categorical and quantitative data? - correct answer Categorical data fits into various categories; whereas, quantitative data has numerical values associated with it. What is a bar chart? - correct answer A display for categorical data which indicates ...
-
AP Statistics Review Question and answers 2023/2024 verified to pass
- Exam (elaborations) • 15 pages • 2023
- $13.99
- + learn more
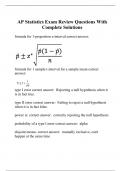
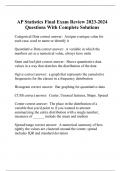
AP Statistics Review Question and answers 2023/2024 verified to pass Addition Rule - correct answer P(A ∪ B) = P(A) + P(A) - P(A ∩ B) aids in computing the chances of one of several events occurring at a given time. Alpha (α) - correct answer The probability of a Type I error. See significance level. Alternative Hypothesis - correct answer The hypothesis stating what the researcher is seeking evidence of. A statement of inequality. It can be written looking for the difference or chan...

-
AP Statistics Exam Review Question and answers rated A+ 2023/2024
- Exam (elaborations) • 24 pages • 2023
- $13.49
- + learn more
AP Statistics Exam Review Question and answers rated A+ 2023/2024 What is a dot plot? - correct answer A graphical display which shows "dots" for each point. It's good for categorical data- ie data classified into categories. What's the difference between categorical and quantitative data? - correct answer Categorical data fits into various categories; whereas, quantitative data has numerical values associated with it. What is a bar chart? - correct answer A display for categorical dat...
-
AP Statistics Exam Study Guide Questions with complete solution 2023/2024
- Exam (elaborations) • 24 pages • 2023
- $13.49
- + learn more
AP Statistics Exam Study Guide Questions with complete solution 2023/2024How is a population measured? - correct answer a population is measured by a census. How is a sample measured? - correct answer A sample is measured using a sampling technique, of which there are several. Why do we often measure samples instead of populations? - correct answer Collecting data from an entire population is often impossible, infeasible, or beyond the capability of the resources we have available. Samples...
-
AP Statistics Exam Review 2023/2024
- Exam (elaborations) • 18 pages • 2023
- $13.49
- + learn more
AP Statistics Exam Review 2023/2024

Fear of missing out? Then don’t!

-
AP Statistics Flashcards question n answers graded A+ 2023 passed
- Exam (elaborations) • 15 pages • 2023
- $19.99
- + learn more
AP Statistics FlashcardsStatistic - correct answer is a single measure of some attribute of a sample parameter - correct answer a quantity (such as the mean or variance) that characterizes a statistical population and that can be estimated by calculations from sample data parameter - correct answer any factor that defines a system and determines its performance Parameters of equations - correct answer Uniform: min and max [also need to know whether distrib. is discrete or continuous] ...
-
AP Statistics question with commplete solution 2023
- Exam (elaborations) • 14 pages • 2023
- $17.99
- + learn more
AP Statistics Inference for Regression (CONDITIONS) - correct answer Linear: True relationship between the variables is linear. Independent: observations, 10% condition if sampling without replacement. Normal: Responses vary normally around the regression line for all x-values Equal Variance: around the regression line for all x-values Random: Data from a random sample or randomized experiment Paired t-test: Phrasing Hints, H0 and Ha, Conclusion - correct answer Key Phrase: MEAN DIFFER...
-
AP Statistics Exam Review Questions With Complete Solutions
- Exam (elaborations) • 8 pages • 2023
- $11.49
- + learn more
AP Statistics Exam Review Questions With Complete Solutions
-
AP Statistics Final Exam Review 2023-2024 Questions With Complete Solutions
- Exam (elaborations) • 9 pages • 2023
- $10.99
- + learn more
Categorical Data correct answer: Assigns a unique value for each case, used to name or identify it Quantitative Data correct answer: A variable in which the numbers act as a numerical value, always have units Stem and leaf plot correct answer: Shows quantitative data values in a way that sketches the distribution of the data Ogive correct answer: a graph that represents the cumulative frequencies for the classes in a frequency distribution Histogram correct answer: Bar graphing ...
-
AP Statistics Practice Exam Test Questions 2024.
- Exam (elaborations) • 16 pages • 2024
- $11.49
- + learn more
AP Statistics Practice Exam Test Questions 2024.5 number summary - correct answer The minimum value, lower quartile, median, upper quartile, and maximum value for a data set. These five values give a summary of the shape of the distribution and are used to make box plots. The five numbers that help describe the center, spread and shape of data z score - correct answer a measure of how many standard deviations you are away from the norm (average or mean) -Number of standard deviati...
