Descriptives Study guides, Class notes & Summaries
Looking for the best study guides, study notes and summaries about Descriptives? On this page you'll find 38 study documents about Descriptives.
Page 2 out of 38 results
Sort by
-
Epidemiology Questions Answered 100% correct
- Exam (elaborations) • 5 pages • 2023
- $17.99
- + learn more
Epidemiology Questions Answered 100% correct Population Groups as opposed to individuals Disease Frequency identifying and counting cases 3 factors that involve disease frequency Disease definition, mechanism for counting, determining size of population Disease Distribution person,place, and time Disease Determinants risk or preventive factors what are some risk or preventative factors associated with disease determinants Genetic makeup, gender, age, imm...

-
4 Macroeconomic objectives summary and description
- Summary • 70 pages • 2022
- $9.99
- + learn more
4 Macroeconomic objectives summary and description
-
PUBH Final Exam Questions With Answers | Latest Update 2023/2024 (GRADED A+)
- Exam (elaborations) • 14 pages • 2023
- $16.49
- + learn more
What is a codebook? Who might create one, what would she or he include in it, and what purpose or purposes would it serve? A codebook is a separate document such as a Word document or Excel spreadsheet that stores all the critical information about the data. It includes the variables, name of the variables, a brief description of the variables, questionnaire items, a sentence explaining what each variable represents, and an explanation of each numerical code. A codebook serves as a record ...
-
STAT 252 LAB 1 University of Alberta STAT 252 (Questions and Answers)
- Exam (elaborations) • 11 pages • 2023
- $7.99
- + learn more
1. Comment on the study design. In particular, is this an observational study or experimental study? What kind of inference or interpretation can you make? Is it possible to establish a causal link between the speed limit increases and the change in interstate traffic fatalities using this data? What is the population of interest? Can the findings be generalized to this population? This is an observational study as the data has been collected from previous study and the researcher has had ...
-
SPSS - Technieken voor Causale Analyse - Practicals + Exercisebook volledig uitgewerkt! Handleiding voor het halen van je tentamen!
- Summary • 20 pages • 2023
- $7.39
- 2x sold
- + learn more
Hoi! Als je momenteel op zoek bent naar een document om je SPSS tentamen te halen, heb je zojuist de perfecte handleiding gevonden! Na heel wat uren gepuzzeld te hebben om SPSS volledig te begrijpen, heb ik het voor elkaar gekregen een 'handleiding' van SPSS te creëren die jou 99% garantie geeft dat jij je tentamen haalt! Dit document van 20 pagina's is voornamelijk in het Engels geschreven, af en toe staan er wat Nederlandse zinnen tussen met belangrijke informatie. De eerste 10 pagina's v...

Fear of missing out? Then don’t!

-
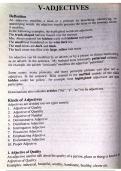
Comprehensive Guide to Adjectives: Mastering Descriptive Language
- Summary • 14 pages • 2024
- $3.19
- + learn more
Enhance your understanding of adjectives with this in-depth guide that covers everything you need to know about descriptive language. This document provides clear explanations, classifications, examples, and practical tips on effectively using adjectives in your writing and speech. Ideal for students, educators, and anyone looking to refine their grammar skills, this resource is perfect for exam preparation or improving language proficiency.
-
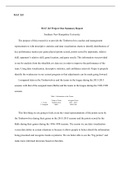
MAT 243 Project One Summary Report .docx MAT 243 MAT 243 Project One Summary Report Southern New Hampshire University The purpose of this research is to provide the Timberwolves coaches and management representatives with descriptive statistics and da
- Summary • 21 pages • 2021
- $7.49
- 1x sold
- + learn more
MAT 243 Project One Summary Report .docx MAT 243 MAT 243 Project One Summary Report Southern New Hampshire University The purpose of this research is to provide the Timberwolves coaches and management representatives with descriptive statistics and data visualization charts to identify distributions of key performance metrics per game played (points scored, points scored by opponents, relative skill, opponents relative skill, game location, and game result). This information was provided to ...
-
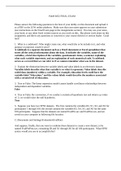
PubH_6052_Final_Exam_.docx
- Exam (elaborations) • 13 pages • 2021
- $15.49
- 2x sold
- + learn more
PubH 6052 FINAL EXAM Please answer the following questions to the best of your ability on this document and upload it as a PDF on the 2GW online platform. Make sure that your name appears on your submission (see instructions on the Final Exam page in the Assignments section). You may use your notes, your book, or any other fixed written sources as you work on this. But please work alone on this assignment, and direct any questions or concerns to your course director or section leader. G...
-
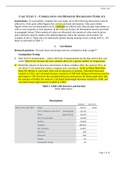
EXSC 520 CASE STUDY 1 – CORRELATION AND BIVARIATE REGRESSION TEMPLATE
- Exam (elaborations) • 18 pages • 2022
- $21.49
- + learn more
EXSC 520 CASE STUDY 1 – CORRELATION AND BIVARIATE REGRESSION TEMPLATE Instructions: To successfully complete this case study, all of the following instructions must be adhered to. Only paste tables/figures that contain pertinent information. Only paste tables/ figures where you are instructed to do so. Highlight (in yellow) only relevant data from tables; as well as your response to each question. In the write-up section, all information must be provided in paragraph format. When statisti...
-
Statistics Analysis DAT 565: Data Analysis and Business Analytics
- Exam (elaborations) • 9 pages • 2022
- $7.49
- + learn more
This statistical report is based on the Pastas R Us, Inc. Database. Descriptive statistical analyses were done on the database using Excel. The statistical analysis was conducted on the Pastas R Us, Inc. Database with the main aim of determining the Descriptives of the data, as shown in the following paragraphs. Calculation of the Mean, standard deviation, skew, 5-number summary, and interquartile range (IQR) for each of the variables. The Mean, standard deviation, skew, 5-number summary, and ...
