Improve your search results. Select your educational institution and subject so that we can show you the most relevant documents and help you in the best way possible.
Ok, I understand!
Your school or university
Improve your search results. Select your educational institution and subject so that we can show you the most relevant documents and help you in the best way possible.
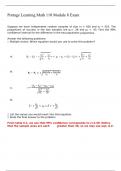
MATH 110 Module 8 Exam Scored 100% - Portage Learning. Suppose we have independent random samples of size n1 = 615 and n2 = 505. The proportions of success in the two samples are p1= .53 and p2 = .45. Find the 90% confidence interval for the difference in the two population proportions. Answer the following questions: 1. Multiple choice: Which equation would you use to solve this problem? A. B. C. D. 2. List the values you would insert into that equation. 3. State the final answer to the problem...
MATH 110 Module 8 Exam Scored 100% - Portage Learning 2023
Last document update:
ago
MATH 110 Module 8 Exam Scored 100% - Portage Learning. Suppose we have independent random samples of size n1 = 615 and n2 = 505. The proportions of success in the two samples are p1= .53 and p2 = .45. Find the 90% confidence interval for the difference in the two population proportions. Answer the following questions: 1. Multiple choice: Which equation would you use to solve this problem? A. B. C. D. 2. List the values you would insert into that equation. 3. State the final answer to the problem...
MATH 110 Module 8 Exam Scored 100% - Portage Learning. Suppose we have independent random samples of size n1 = 615 and n2 = 505. The proportions of success in the two samples are p1= .53 and p2 = .45. Find the 90% confidence interval for the difference in the two population proportions. Answer the following questions: 1. Multiple choice: Which equation would you use to solve this problem? A. B. C. D. 2. List the values you would insert into that equation. 3. State the final answer to the problem...
MATH 110 Module 8 Exam Scored 100% - Portage Learning 2023
Last document update:
ago
MATH 110 Module 8 Exam Scored 100% - Portage Learning. Suppose we have independent random samples of size n1 = 615 and n2 = 505. The proportions of success in the two samples are p1= .53 and p2 = .45. Find the 90% confidence interval for the difference in the two population proportions. Answer the following questions: 1. Multiple choice: Which equation would you use to solve this problem? A. B. C. D. 2. List the values you would insert into that equation. 3. State the final answer to the problem...
MATH 110 MODULE 5:Introduction to Statistics Exam 2022 100% Suppose that you take a sample of size 50 from a population that is not normally distributed. Can the sampling distribution of x̄be approximated by a normal probability distribution? Yes because the sample size could be approximated by a normal probability due to the sample size being larger than 30.Yes. The sample size is greater than 30, therefore, we may approximate by a normal probability distribution. Question 2 Your Answer: You m...
MATH 110 MODULE 5:Introduction to Statistics Exam 2023 100%
Last document update:
ago
MATH 110 MODULE 5:Introduction to Statistics Exam 2022 100% Suppose that you take a sample of size 50 from a population that is not normally distributed. Can the sampling distribution of x̄be approximated by a normal probability distribution? Yes because the sample size could be approximated by a normal probability due to the sample size being larger than 30.Yes. The sample size is greater than 30, therefore, we may approximate by a normal probability distribution. Question 2 Your Answer: You m...
MATH 110 MODULE 5:Introduction to Statistics Exam 2022 100% Suppose that you take a sample of size 50 from a population that is not normally distributed. Can the sampling distribution of x̄be approximated by a normal probability distribution? Yes because the sample size could be approximated by a normal probability due to the sample size being larger than 30.Yes. The sample size is greater than 30, therefore, we may approximate by a normal probability distribution. Question 2 Your Answer: You m...
MATH 110 MODULE 5:Introduction to Statistics Exam 2023 100%
Last document update:
ago
MATH 110 MODULE 5:Introduction to Statistics Exam 2022 100% Suppose that you take a sample of size 50 from a population that is not normally distributed. Can the sampling distribution of x̄be approximated by a normal probability distribution? Yes because the sample size could be approximated by a normal probability due to the sample size being larger than 30.Yes. The sample size is greater than 30, therefore, we may approximate by a normal probability distribution. Question 2 Your Answer: You m...
MATH 110 MODULE 4: Problem Set 3: Introduction to Statistics Solutions 100% Find P(Z ≥ - 1.07). P(Z ≤ - 1.07) is given directly in the standard normal table and is found to be .14231. So, P(Z ≥ - 1.07) = 1 - P(Z ≤ - 1.07) =1 - .14231 = .85769
MATH 110 MODULE 4: Problem Set 3: Introduction to Statistics Solutions 100%
Last document update:
ago
MATH 110 MODULE 4: Problem Set 3: Introduction to Statistics Solutions 100% Find P(Z ≥ - 1.07). P(Z ≤ - 1.07) is given directly in the standard normal table and is found to be .14231. So, P(Z ≥ - 1.07) = 1 - P(Z ≤ - 1.07) =1 - .14231 = .85769
MATH 110 MODULE 4: Problem Set 3: Introduction to Statistics Solutions 100% Find P(Z ≥ - 1.07). P(Z ≤ - 1.07) is given directly in the standard normal table and is found to be .14231. So, P(Z ≥ - 1.07) = 1 - P(Z ≤ - 1.07) =1 - .14231 = .85769
MATH 110 MODULE 4: Problem Set 3: Introduction to Statistics Solutions 100%
Last document update:
ago
MATH 110 MODULE 4: Problem Set 3: Introduction to Statistics Solutions 100% Find P(Z ≥ - 1.07). P(Z ≤ - 1.07) is given directly in the standard normal table and is found to be .14231. So, P(Z ≥ - 1.07) = 1 - P(Z ≤ - 1.07) =1 - .14231 = .85769
MATH 110 Exam 1 (Combination Of Exam Answers) – Portage Learning Variable. A variable is defined as a "particular measurable attribute that the researcher believes is needed to describe the element in their study" (Module 1). c) Data. Data (or the plural of datumn) is defined as things (such as numerical information, people, geographical areas,etc.) about which information can be collected and then analyzed. Answer Key Define each of the following: a) Element. a) The element of a data set is...
MATH 110 Exam 1 (Combination Of Exam Answers) – Portage Learning 2023
Last document update:
ago
MATH 110 Exam 1 (Combination Of Exam Answers) – Portage Learning Variable. A variable is defined as a "particular measurable attribute that the researcher believes is needed to describe the element in their study" (Module 1). c) Data. Data (or the plural of datumn) is defined as things (such as numerical information, people, geographical areas,etc.) about which information can be collected and then analyzed. Answer Key Define each of the following: a) Element. a) The element of a data set is...
MATH 110 Exam 1 (Combination Of Exam Answers) – Portage Learning Variable. A variable is defined as a "particular measurable attribute that the researcher believes is needed to describe the element in their study" (Module 1). c) Data. Data (or the plural of datumn) is defined as things (such as numerical information, people, geographical areas,etc.) about which information can be collected and then analyzed. Answer Key Define each of the following: a) Element. a) The element of a data set is...
MATH 110 Exam 1 (Combination Of Exam Answers) – Portage Learning 2023
Last document update:
ago
MATH 110 Exam 1 (Combination Of Exam Answers) – Portage Learning Variable. A variable is defined as a "particular measurable attribute that the researcher believes is needed to describe the element in their study" (Module 1). c) Data. Data (or the plural of datumn) is defined as things (such as numerical information, people, geographical areas,etc.) about which information can be collected and then analyzed. Answer Key Define each of the following: a) Element. a) The element of a data set is...