MATHG163
Rasmussen College
Here are the best resources to pass MATHG163. Find MATHG163 study guides, notes, assignments, and much more.
All 1 results
Sort by
-
stat_mod_2.pdf
- Other • 53 pages • 2023
- $4.49
- + learn more
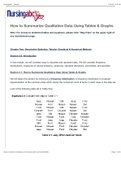
Summarizing Quantitative Data Using Tables & Graphs
Section 2.3: Summarizing Quantitative Data Using Tables & Graphs
In this section, we summarize quantitative data. We begin by considering frequency distributions of numerical, or quantitative, data. The most important difference between summarizing numerical data and non-numerical data is in the defining of the classes. In example 2.1 of the previous section, each class was clearly defined because each class (i.e. each car model), was indepen...
Other
stat_mod_2.pdf
Last document update:
ago
Summarizing Quantitative Data Using Tables & Graphs Section 2.3: Summarizing Quantitative Data Using Tables & Graphs In this section, we summarize quantitative data. We begin by considering frequency distributions of numerical, or quantitative, data. The most important difference between summarizing numerical data and non-numerical data is in the defining of the classes. In example 2.1 of the previous section, each class was clearly defined because each class (i.e. each car model), was indepen...
$4.49
Add to cart

Want to regain your expenses?

