Improve your search results. Select your educational institution and subject so that we can show you the most relevant documents and help you in the best way possible.
Ok, I understand!
Your school or university
Improve your search results. Select your educational institution and subject so that we can show you the most relevant documents and help you in the best way possible.
1. Question:Arealestateanalysthasdevelopedamultipleregressionline,y=60+0.068x1–2.5x2,topredicty=themarketpriceofahome(in
$1,000s),usingindependentvariables,x1=thetotalnumberofsquare feetoflivingspace,andx2=theageofthehouseinyears.The regressioncoefficientofx2suggeststhis: _____.
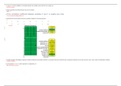
2. Question:Thefollowingisapartialcomputeroutputofamultipleregressionanalysis of a data set containing 20 sets of observations on thedependentvariable.
Theregressionequationis
SALEPRIC=1470+0.8145LANDVAL+0.8204IMP...
MATH 534 Week 7 Homework Problems
Last document update:
ago
1. Question:Arealestateanalysthasdevelopedamultipleregressionline,y=60+0.068x1–2.5x2,topredicty=themarketpriceofahome(in
$1,000s),usingindependentvariables,x1=thetotalnumberofsquare feetoflivingspace,andx2=theageofthehouseinyears.The regressioncoefficientofx2suggeststhis: _____.
2. Question:Thefollowingisapartialcomputeroutputofamultipleregressionanalysis of a data set containing 20 sets of observations on thedependentvariable.
Theregressionequationis
SALEPRIC=1470+0.8145LANDVAL+0.8204IMP...
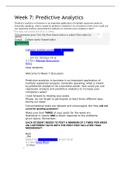
Predictive analytics in business is an important application of multiple regression analysis.Generallyspeaking,whatismeantbypredictiveanalytics?Asabusinessowner,howcouldyouuseregressionanalysisand predictive analyticsto increase your company'ssales?
MATH 534 Week 7 Discussion; Predictive Analytics
Last document update:
ago
Predictive analytics in business is an important application of multiple regression analysis.Generallyspeaking,whatismeantbypredictiveanalytics?Asabusinessowner,howcouldyouuseregressionanalysisand predictive analyticsto increase your company'ssales?
Predictiveanalyticsisaninnovativeanalyticsdivisionthatuseshistoricaldatacombinedwith mathematical simulation, data mining techniques and machine learning to makeforecasts about future results.In order to detect threats and prospects, businessesemploy predictiveanalytics tofindtrendsin thisknowledge.
Regression analysis refers to a process of mathematically sorting out which factorscouldhaveaneffect.Forasmallenterprise,thevalueofregressionanalysis isthatithelps decide which variables matter most...
MATH 534 Week 7 Discussion; Predictive Analytics (Keller)
Last document update:
ago
Predictiveanalyticsisaninnovativeanalyticsdivisionthatuseshistoricaldatacombinedwith mathematical simulation, data mining techniques and machine learning to makeforecasts about future results.In order to detect threats and prospects, businessesemploy predictiveanalytics tofindtrendsin thisknowledge.
Regression analysis refers to a process of mathematically sorting out which factorscouldhaveaneffect.Forasmallenterprise,thevalueofregressionanalysis isthatithelps decide which variables matter most...
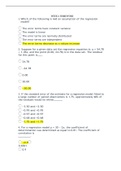
1. Question: A value of -1 for the coefficient of correlation between two variables means that the two variables are _____________.
2. Question: If there is positive correlation between two sets of numbers, then ____________-.
3. Question: If the correlation coefficient between variables X and Y is roughly zero, then ___________.
4. Question: Determine the Pearson product-moment correlation coefficient for the following data.
5. Question: A quality manager is developing a regression model to...
Final Project: Regression and Correlation Analysis
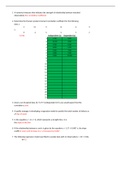
Use the dependent variable (labeled Y) and one of the independent variables (labeled X1, X2, and X3) in the data file. Select and use one independent variable throughout this analysis. Use Excel to perform the regression and correlation analysis to answer the following. The week 6 spreadsheet can ... helpful in this work.
1. Generate a scatterplot for the ... dependent variable (Y) and the ... independent variable (X), including the graph of t...
MATH 534 Week 7 Course Project, Final Part C; Regression and Correlation Analysis
Last document update:
ago
Final Project: Regression and Correlation Analysis
Use the dependent variable (labeled Y) and one of the independent variables (labeled X1, X2, and X3) in the data file. Select and use one independent variable throughout this analysis. Use Excel to perform the regression and correlation analysis to answer the following. The week 6 spreadsheet can ... helpful in this work.
1. Generate a scatterplot for the ... dependent variable (Y) and the ... independent variable (X), including the graph of t...
1. Question: A value of -1 for the coefficient of correlation between two variables means that the two variables are _____________.
2. Question: If there is positive correlation between two sets of numbers, then ____________-.
3. Question: If the correlation coefficient between variables X and Y is roughly zero, then ___________.
4. Question: Determine the Pearson product-moment correlation coefficient for the following data.
5. Question: A quality manager is developing a regression model to...
Suppose you are given data from a survey showing the IQ of each person interviewed and the IQof his or her mother. That is all the information that you have. Your boss has asked you to puttogether a report showing the relationship between these two variables. What could you present,and why?
MATH 534 Week 6 Discussion; Regression Analysis
Last document update:
ago
Suppose you are given data from a survey showing the IQ of each person interviewed and the IQof his or her mother. That is all the information that you have. Your boss has asked you to puttogether a report showing the relationship between these two variables. What could you present,and why?
MATH534 Final Exam Solution’s Study Guide | 2022 LATEST UPDATE
Exam (elaborations) • 7
pages
• 2022
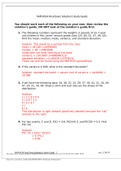
MATH534 Final Exam Solution’s Study Guide You should work each of the following on your own, then review the solution’s guide. DO NOT look at the solution’s guide first. 1. The following numbers represent the weights in pounds of six 7-year old children in Mrs. Jones' second grade class (25, 60, 51, 47, 49, 45). Find the mean, median, mode, variance, and standard deviation.If the variance is 846, what is the standard deviation?
MATH534 Final Exam Solution’s Study Guide | 2022 LATEST UPDATE
Last document update:
ago
MATH534 Final Exam Solution’s Study Guide You should work each of the following on your own, then review the solution’s guide. DO NOT look at the solution’s guide first. 1. The following numbers represent the weights in pounds of six 7-year old children in Mrs. Jones' second grade class (25, 60, 51, 47, 49, 45). Find the mean, median, mode, variance, and standard deviation.If the variance is 846, what is the standard deviation?
And that's how you make extra money
Did you know that on average a seller on Stuvia earns $82 per month selling study resources? Hmm, hint, hint.
Discover all about earning on Stuvia