Advanced economics summary
Chapter 11, 30, 31, 33, 35 and 36
CHAPTER 11 SUMMARY
Four market models
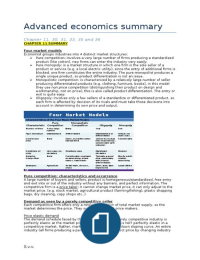
Economist groups industries into 4 distinct market structures:
Pure competition: involves a very large number of firms producing a standardized
product (like cotton), new firms can enter the industry very easily.
Pure monopoly: is a market structure in which one firm is the sole seller of a
product or service (e.g. a local electric utility), since the entry of additional firms is
blocked, one firm constitutes the entire industry. The pure monopolist produces a
single unique product, so product differentiation is not an issue.
Monopolistic competition: is characterized by a relatively large number of seller
producing differentiated products (e.g. clothing, furniture, books), in this model
they use non price competition (distinguishing their product on design and
workmanship, not on price), this is also called product differentiation. The entry or
exit is quite easy.
Oligopoly: involves only a few sellers of a standardize or differentiated product, so
each firm is affected by decision of its rivals and must take those decisions into
account in determining its own price and output.
Four Market Models
Characteristics of the Four Basic Market Models
Pure Monopolistic
Characteristic Competition Competition Oligopoly Monopoly
Number of firms A very large Many Few One
number
Type of product Standardized Differentiated Standardized or Unique; no
differentiated close subs.
Control over None Some, but within rather Limited by mutual Considerable
price narrow limits inter-dependence;
considerable with
collusion
Conditions of Very easy, no Relatively easy Significant Blocked
entry obstacles obstacles
Nonprice None Considerable emphasis Typically a great Mostly public
Competition on advertising, brand deal, particularly relation
names, trademarks with product advertising
differentiation
Examples Agriculture Retail trade, dresses, Steel, auto, farm Local utilities
shoes implements 3
LO1
Pure competition: characteristics and occurrence
A large number of buyers and sellers, product is homogeneous/standardized, free entry
and exit into or out of the industry without any barriers, and perfect information. The
competitive firm is a price taker: it cannot change market price, it can only adjust to the
market price. (e.g. stock market, agricultural product (farming/fishing), plastic shopping
bags, dry cleaning, copy shops etc..)
Demand as seen by a purely competitive seller
Each competitive firm offers only a negligible fraction of total market supply, so the
market determines the price. They are price taker not price makers.
Price elastic demand
The demand schedule faced by the individual firm in a purely competitive industry is
perfectly elastic at the market price. The market demand is NOT perfectly elastic in a
competitive market. Rather, market demand graphs as a down sloping curve. An entire
industry (all firms producing a particular product) can affect price by changing industry
S.v.v.
,output. Not by changing individual output because one firm is to small for that big
market.
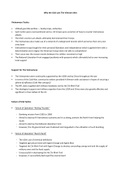
Average, Total and Marginal revenue
The demand schedule is also its average-revenue schedule. Price and average revenue
are the same thing.
Total revenue (TR) = price x quantity sold (P * Q)
Marginal revenue (MR) = change in TR / change in Q
In pure competition marginal revenue and price are equal.
Total, and Marginal Revenue
Firm’s Firm’s TR
Demand Revenue
Schedule Data
(Average
Revenue)
QD P TR MR
0 $131 $0
] $131
1 131 131
] 131
2 131 262
] 131
3 131 393
] 131
4 131 524
] 131
5 131 655
] 131
6 131 786
] 131
7 131 917
] 131 D =MR =P
8 131 1048
] 131
9 131 1179
10 131 1310
] 131
8
LO3
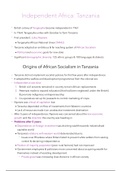
Profit maximization in the short run: Total revenue – Total cost approach
At break even point there is no economic profit, but TR covers TC, break-even point is an
output at which a firm makes a normal profit, but no economic profit. Any output between
the two break-even points in the graph underneath will create an economic profit.
Profit Maximization: TR–TC Approach (1)
$1800
1700
1600 Break-Even Point
Total Revenue and Total Cost
1500 (Normal Proft)
1400
1300 Total Revenue, (TR)
1200
1100
Maximum
1000
Economic
Proft Total Cost,
900
800
$299 (TC)
700
600
500 P=$131
400
300
200 Break-Even Point
100 (Normal Proft)
0 1 2 3 4 5 6 7 8 9 10 11 1213 14
Total Economic
Quantity Demanded (Sold)
$500
Total Economic $299
Profit
400
300 Proft
200
100
0 1 2 3 4 5 6 7 8 9 10 11 1213 14
Quantity Demanded (Sold)
12
LO3
S.v.v.
, Profit Maximization (p. 272) : TR-TC Approach (1)
The Proft-Maximizing Output for a Purely Competitive Firm: Total Revenue –
Total Cost Approach (Price =$131)
(1) (2) (3) (4) (5) (6)
Total Product Total Fixed Cost Total Variable Total Cost Total Revenue Profit (+)
(Output) (Q) (TFC) Costs (TVC) (TC) (TR) or Loss (-)
0 $100 $0 $100 $0 $-100
1 100 90 190 131 -59
2 100 170 270 262 -8
3 100 240 340 393 +53
4 100 300 400 524 +124
5 100 370 470 655 +185
6 100 450 550 786 +236
7 100 540 640 917 +277
8 100 650 750 1048 +298
9 100 780 880 1179 +299
10 100 930 1030 1310 +280
11
LO3
CHAPTER 30 SUMMARY
LO1 - The income-consumption and income-saving relationships
The other-things-equal relationship between income and consumption is one of the best-
established relationships in macroeconomics. Personal saving is defined as “not
spending” or as “that part of DI not consumed”. Many factors determine a nations levels
of consumption and saving, but the most significant is DI (disposable income; income
after taxes). DI = C + S
The consumption schedule (consumption function)
In the aggregate, households increase their spending as their DI rises and spend a larger proportion of a small DI
than of a large DI (people save and spend more when they have a higher domestic income).
Break even point = (also called) break even income, at this point households plan to consume their entire
incomes (C=DI)
S.v.v.
,The saving schedule (saving function)
S = DI – C. households can consume more than their current incomes by liquidating (selling for cash)
accumulated wealth or by borrowing.
Break even point = (also called) break even income, at this point households plan to consume their entire
incomes (C=DI). Saving is zero at Break even income level.
Average and marginal propensities (propensity = a tendency or habit)
APC average propensity to consume (the percentage of total income that is consumed)
APC = C / Y
APS average propensity to safe (the percentage of total income that is saved)
APS = S / Y
APC falls when DI is increasing, while APS rises when DI goes up. APC + APS = 100 % (1).
Marginal = ‘extra’ or ‘a change in’
MPC marginal propensity to consume (the % of any change in income consumed).
MPC = change in C / change in Y
MPS marginal propensity to safe (the % of any change in income saved)
MPS = change in S / change in Y
MPC + MPS = 100% (1)
LO3 – The Interest-Rate-Investment relationship
Investment consists of expenditures on new plants, capital equipment, machinery,
inventories, and so on. Investment decision is a MB / MC decision.
Two basic determinants of investment spending:
1. Expected return profits
2. The interest rate
Expected rate of return
When you buy a machine of $1000, and you expect to make revenue of $1100, the profit
will than be $100, you divide $100 by $1000 (=10%). So the expected rate of return (r) is
10%. This is NOT a guaranteed rate of return.
S.v.v.
, The real interest rate
One important cost associated with investing is interest, which is the financial cost of
borrowing money. (money capital; equipment real (economic) capital). The interest
cost is, the interest rate (i) (e.g. 7%) multiplied by the $1000 (the borrowed money to buy
the machine). So the interest cost will be $70. If the interest rate is less than the
expected rate of return, the investment should be undertaken. This guideline applies
even if a firm finances the investment internally out of funds saved from past profit. The
role of the investment decision does not change. When a firm uses money to invest in
equipment, it incurs an opportunity cost because it forgoes the interest income it could
have earned by lending the funds to someone else.
The real interest rate; is stated in dollars of constant or inflation-adjusted value.
Rather than, the nominal interest rate; is expressed in dollars of current value.
Investment demand curve
Is down sloping, the level of investment depends on the expected rate of return (r), and
the real interest rate (i).
The lower the interest rate the more demand for investment OR the higher the interest
rate the less demand for investment
LO5 - The multiplier effect
A change in spending changes real GDP more than initial change in spending.
Multiplier = Change in real GDP / initial change in spending (Investment or C)
Change in GDP = multiplier x initial change in spending
In this case the multiplier is 4 ($20/ $5)
S.v.v.
Chapter 11, 30, 31, 33, 35 and 36
CHAPTER 11 SUMMARY
Four market models
Economist groups industries into 4 distinct market structures:
Pure competition: involves a very large number of firms producing a standardized
product (like cotton), new firms can enter the industry very easily.
Pure monopoly: is a market structure in which one firm is the sole seller of a
product or service (e.g. a local electric utility), since the entry of additional firms is
blocked, one firm constitutes the entire industry. The pure monopolist produces a
single unique product, so product differentiation is not an issue.
Monopolistic competition: is characterized by a relatively large number of seller
producing differentiated products (e.g. clothing, furniture, books), in this model
they use non price competition (distinguishing their product on design and
workmanship, not on price), this is also called product differentiation. The entry or
exit is quite easy.
Oligopoly: involves only a few sellers of a standardize or differentiated product, so
each firm is affected by decision of its rivals and must take those decisions into
account in determining its own price and output.
Four Market Models
Characteristics of the Four Basic Market Models
Pure Monopolistic
Characteristic Competition Competition Oligopoly Monopoly
Number of firms A very large Many Few One
number
Type of product Standardized Differentiated Standardized or Unique; no
differentiated close subs.
Control over None Some, but within rather Limited by mutual Considerable
price narrow limits inter-dependence;
considerable with
collusion
Conditions of Very easy, no Relatively easy Significant Blocked
entry obstacles obstacles
Nonprice None Considerable emphasis Typically a great Mostly public
Competition on advertising, brand deal, particularly relation
names, trademarks with product advertising
differentiation
Examples Agriculture Retail trade, dresses, Steel, auto, farm Local utilities
shoes implements 3
LO1
Pure competition: characteristics and occurrence
A large number of buyers and sellers, product is homogeneous/standardized, free entry
and exit into or out of the industry without any barriers, and perfect information. The
competitive firm is a price taker: it cannot change market price, it can only adjust to the
market price. (e.g. stock market, agricultural product (farming/fishing), plastic shopping
bags, dry cleaning, copy shops etc..)
Demand as seen by a purely competitive seller
Each competitive firm offers only a negligible fraction of total market supply, so the
market determines the price. They are price taker not price makers.
Price elastic demand
The demand schedule faced by the individual firm in a purely competitive industry is
perfectly elastic at the market price. The market demand is NOT perfectly elastic in a
competitive market. Rather, market demand graphs as a down sloping curve. An entire
industry (all firms producing a particular product) can affect price by changing industry
S.v.v.
,output. Not by changing individual output because one firm is to small for that big
market.
Average, Total and Marginal revenue
The demand schedule is also its average-revenue schedule. Price and average revenue
are the same thing.
Total revenue (TR) = price x quantity sold (P * Q)
Marginal revenue (MR) = change in TR / change in Q
In pure competition marginal revenue and price are equal.
Total, and Marginal Revenue
Firm’s Firm’s TR
Demand Revenue
Schedule Data
(Average
Revenue)
QD P TR MR
0 $131 $0
] $131
1 131 131
] 131
2 131 262
] 131
3 131 393
] 131
4 131 524
] 131
5 131 655
] 131
6 131 786
] 131
7 131 917
] 131 D =MR =P
8 131 1048
] 131
9 131 1179
10 131 1310
] 131
8
LO3
Profit maximization in the short run: Total revenue – Total cost approach
At break even point there is no economic profit, but TR covers TC, break-even point is an
output at which a firm makes a normal profit, but no economic profit. Any output between
the two break-even points in the graph underneath will create an economic profit.
Profit Maximization: TR–TC Approach (1)
$1800
1700
1600 Break-Even Point
Total Revenue and Total Cost
1500 (Normal Proft)
1400
1300 Total Revenue, (TR)
1200
1100
Maximum
1000
Economic
Proft Total Cost,
900
800
$299 (TC)
700
600
500 P=$131
400
300
200 Break-Even Point
100 (Normal Proft)
0 1 2 3 4 5 6 7 8 9 10 11 1213 14
Total Economic
Quantity Demanded (Sold)
$500
Total Economic $299
Profit
400
300 Proft
200
100
0 1 2 3 4 5 6 7 8 9 10 11 1213 14
Quantity Demanded (Sold)
12
LO3
S.v.v.
, Profit Maximization (p. 272) : TR-TC Approach (1)
The Proft-Maximizing Output for a Purely Competitive Firm: Total Revenue –
Total Cost Approach (Price =$131)
(1) (2) (3) (4) (5) (6)
Total Product Total Fixed Cost Total Variable Total Cost Total Revenue Profit (+)
(Output) (Q) (TFC) Costs (TVC) (TC) (TR) or Loss (-)
0 $100 $0 $100 $0 $-100
1 100 90 190 131 -59
2 100 170 270 262 -8
3 100 240 340 393 +53
4 100 300 400 524 +124
5 100 370 470 655 +185
6 100 450 550 786 +236
7 100 540 640 917 +277
8 100 650 750 1048 +298
9 100 780 880 1179 +299
10 100 930 1030 1310 +280
11
LO3
CHAPTER 30 SUMMARY
LO1 - The income-consumption and income-saving relationships
The other-things-equal relationship between income and consumption is one of the best-
established relationships in macroeconomics. Personal saving is defined as “not
spending” or as “that part of DI not consumed”. Many factors determine a nations levels
of consumption and saving, but the most significant is DI (disposable income; income
after taxes). DI = C + S
The consumption schedule (consumption function)
In the aggregate, households increase their spending as their DI rises and spend a larger proportion of a small DI
than of a large DI (people save and spend more when they have a higher domestic income).
Break even point = (also called) break even income, at this point households plan to consume their entire
incomes (C=DI)
S.v.v.
,The saving schedule (saving function)
S = DI – C. households can consume more than their current incomes by liquidating (selling for cash)
accumulated wealth or by borrowing.
Break even point = (also called) break even income, at this point households plan to consume their entire
incomes (C=DI). Saving is zero at Break even income level.
Average and marginal propensities (propensity = a tendency or habit)
APC average propensity to consume (the percentage of total income that is consumed)
APC = C / Y
APS average propensity to safe (the percentage of total income that is saved)
APS = S / Y
APC falls when DI is increasing, while APS rises when DI goes up. APC + APS = 100 % (1).
Marginal = ‘extra’ or ‘a change in’
MPC marginal propensity to consume (the % of any change in income consumed).
MPC = change in C / change in Y
MPS marginal propensity to safe (the % of any change in income saved)
MPS = change in S / change in Y
MPC + MPS = 100% (1)
LO3 – The Interest-Rate-Investment relationship
Investment consists of expenditures on new plants, capital equipment, machinery,
inventories, and so on. Investment decision is a MB / MC decision.
Two basic determinants of investment spending:
1. Expected return profits
2. The interest rate
Expected rate of return
When you buy a machine of $1000, and you expect to make revenue of $1100, the profit
will than be $100, you divide $100 by $1000 (=10%). So the expected rate of return (r) is
10%. This is NOT a guaranteed rate of return.
S.v.v.
, The real interest rate
One important cost associated with investing is interest, which is the financial cost of
borrowing money. (money capital; equipment real (economic) capital). The interest
cost is, the interest rate (i) (e.g. 7%) multiplied by the $1000 (the borrowed money to buy
the machine). So the interest cost will be $70. If the interest rate is less than the
expected rate of return, the investment should be undertaken. This guideline applies
even if a firm finances the investment internally out of funds saved from past profit. The
role of the investment decision does not change. When a firm uses money to invest in
equipment, it incurs an opportunity cost because it forgoes the interest income it could
have earned by lending the funds to someone else.
The real interest rate; is stated in dollars of constant or inflation-adjusted value.
Rather than, the nominal interest rate; is expressed in dollars of current value.
Investment demand curve
Is down sloping, the level of investment depends on the expected rate of return (r), and
the real interest rate (i).
The lower the interest rate the more demand for investment OR the higher the interest
rate the less demand for investment
LO5 - The multiplier effect
A change in spending changes real GDP more than initial change in spending.
Multiplier = Change in real GDP / initial change in spending (Investment or C)
Change in GDP = multiplier x initial change in spending
In this case the multiplier is 4 ($20/ $5)
S.v.v.